Skip to content

A single dashboard cannot tell an operator whether a data center is actually greener than it was last year, yet the industry keeps treating one number as if it can. Walk into almost any sustainability briefing from a hyperscaler and the story arrives pre-packaged: a renewable energy percentage, a power usage effectiveness score, or a water intensity figure, each one framed as evidence of responsible growth. The problem is not that these numbers are false. The problem is that they are incomplete, and incomplete metric arbitrage create a dangerous illusion of progress.

The Convenient Math Problem
Sustainability reporting in the data center sector often emphasizes the environmental metrics that align most closely with a company’s sustainability priorities or reporting objectives during a given period. For example, companies addressing concerns about electricity consumption often highlight renewable energy procurement, while those focusing on facility efficiency typically showcase improvements in power usage effectiveness (PUE). Both indicators provide legitimate measures of sustainability, but neither offers a complete environmental assessment on its own.
Each claim remains valid in its own context, but together they expose an important limitation: every metric measures a specific aspect of sustainability rather than the entire environmental footprint. Operators generally report genuine improvements, although many sustainability disclosures emphasize the indicators that show the strongest progress during a reporting period.
This selective emphasis can create what many describe as metric arbitrage, where organizations optimize one sustainability indicator while environmental trade-offs emerge more clearly in other measured areas. A facility might reduce its power usage effectiveness by refining airflow and cooling architecture, representing a genuine engineering achievement, while water withdrawals from a stressed regional aquifer continue to rise. Neither figure misrepresents performance. Both accurately reflect measurable outcomes. Yet the facility’s overall environmental impact across energy, water, land use, and hardware may remain unchanged despite those improvements.

What Optimization Actually Optimizes
Engineers inside the industry rarely set out to game a metric. They respond to whatever target their organization has decided to measure, and that target shapes every subsequent decision about design, siting, and procurement. When PUE becomes the headline number, cooling teams naturally gravitate toward solutions that reduce electrical overhead. Depending on the facility’s heat rejection design, some high-efficiency cooling deployments particularly those using evaporative cooling may also increase water consumption, illustrating the trade-offs between different sustainability metrics.
When carbon intensity becomes a primary reporting metric, procurement teams often expand renewable energy procurement through mechanisms such as power purchase agreements or renewable energy certificates. While these can lower reported emissions, they do not necessarily change the mix of electricity supplying the facility during every hour of operation. The metric does not measure sustainability. The metric measures whatever narrow slice of sustainability someone decided was easiest to quantify and report on a quarterly earnings call.
This is not a uniquely reckless industry behavior. Corporations across manufacturing and logistics have long optimized for whichever key performance indicator investors and regulators actually track. What makes data centers distinct is the scale and speed at which artificial intelligence workloads are multiplying the underlying infrastructure, which means the consequences of measuring the wrong thing compound far faster than they would in a slower-growing sector.
Cooling Efficiency and the Water It Hides
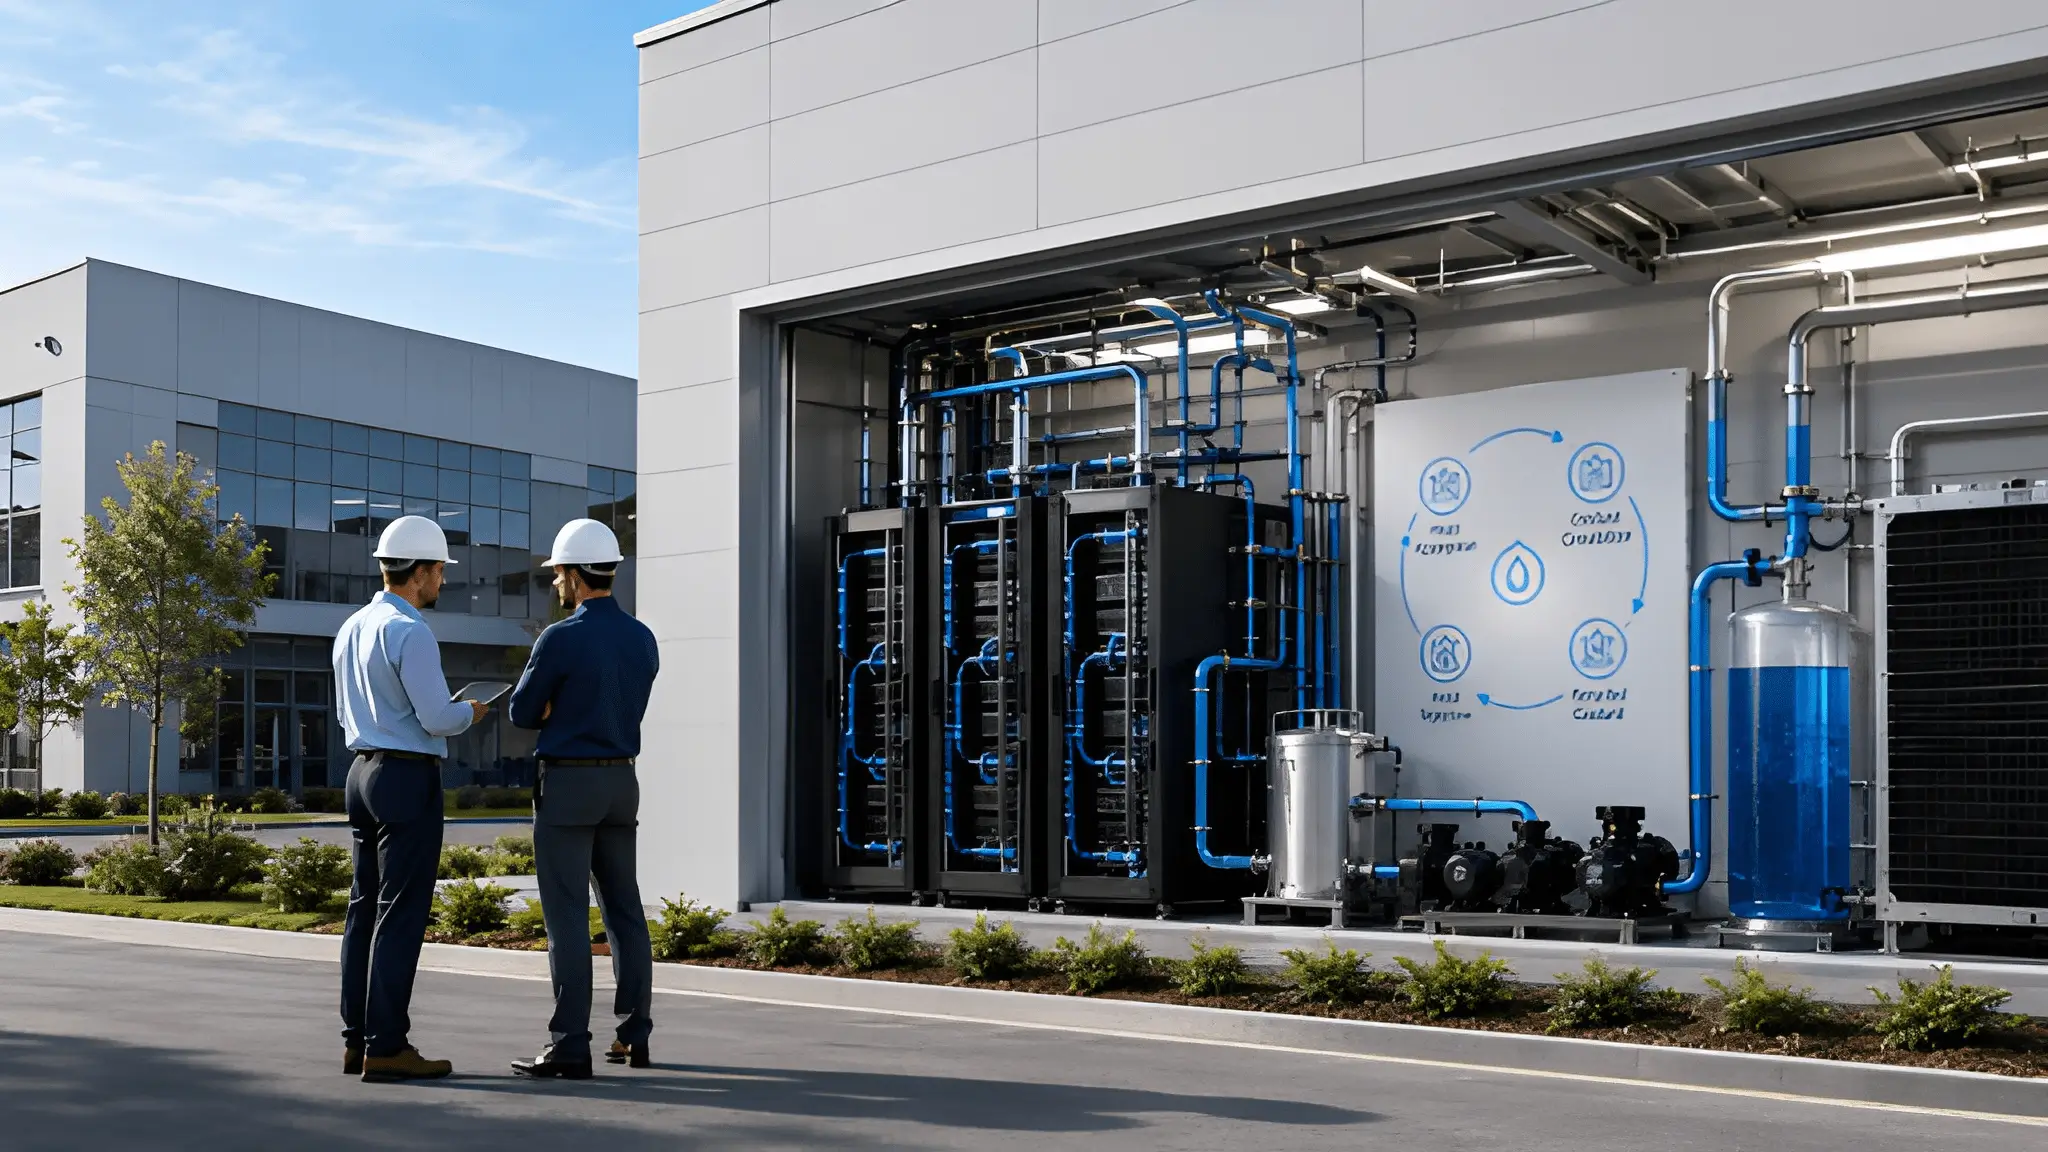
Liquid cooling and direct-to-chip cooling systems have become the industry’s preferred response to rising thermal density from AI accelerators, and they deliver real, measurable energy-efficiency gains. A lower PUE score genuinely reflects less wasted electricity for every unit of computing delivered. However, the score does not capture the volume of water some of these systems consume, particularly evaporative cooling designs operating in water-stressed regions where local communities and agricultural users compete for the same supply. An operator can achieve an industry-leading PUE while significantly increasing onsite water consumption, especially when it relies on evaporative cooling. Although many sustainability reports disclose both PUE and water metrics, they do not always present the relationship and trade-offs between those measures in an integrated way.
Renewable Percentages and the Grid Behind Them
Renewable energy percentages face a similar credibility gap. A company can report that one hundred percent of its annual electricity consumption is matched by renewable energy purchases while its data centers still draw heavily from fossil-fuel-generated power during the specific hours when solar and wind output is low. Annual renewable energy matching became widely adopted before today’s rapid expansion of AI infrastructure and continuous high-density computing workloads. As a result, it may not fully reflect the hour-by-hour electricity sources supplying facilities that operate around the clock. The metric technically holds up. The hour-by-hour reality of what actually powers the servers tells a more complicated story that rarely makes it into a press release.
Perhaps the least discussed piece of this puzzle is hardware turnover. The rapid pace of AI accelerator development has shortened refresh cycles across the industry, with operators replacing GPUs and supporting infrastructure faster than traditional server hardware was ever replaced. Every replacement cycle carries embodied carbon and material impacts from manufacturing, transport, and eventual end-of-life processing. These impacts are distinct from operational carbon intensity metrics, which primarily measure emissions associated with electricity consumption during facility operation. An operator can appear increasingly efficient based on operational performance metrics while simultaneously generating larger volumes of retired hardware, impacts that are typically captured through life-cycle assessment or Scope 3 reporting rather than operational efficiency metrics.
Toward Honest Accounting
None of this suggests that data center operators are acting in bad faith, and it would be unfair and unverified to claim otherwise. What it suggests is that sustainability reporting often relies on metrics that are relatively standardized and straightforward to measure, while no single reporting framework yet captures every major environmental dimension of data center operations in an integrated manner. A more honest framework would require operators, regulators, and investors to evaluate energy, water, grid impact, and hardware lifecycle together, accepting that a genuine improvement in one dimension means very little without visibility into what happened to the others. Until more integrated sustainability accounting becomes standard practice, individual environmental metrics will continue to provide only partial insight into overall environmental performance, increasing the risk that improvements in one area are interpreted as representing the complete sustainability picture.