Skip to content

A high-density rack changes more than the electrical design around it; it changes what sustainability data needs to explain. When average rack demand reaches roughly 26 kW, the same computing capacity can occupy substantially less physical space while concentrating energy use into a smaller operational area. That concentration creates a reporting problem when site-level metrics describe performance without showing where intensity actually sits. A facility can record a familiar PUE value while a small cluster of racks drives a disproportionate share of electricity consumption, cooling demand, and associated emissions. The environmental story therefore needs more operational granularity than a building-wide annual number can provide. For enterprise customers, the question is no longer simply whether a site reports efficiently, but whether its underlying evidence explains how that efficiency was achieved.

The reporting trail can become more demanding when dense compute operates continuously rather than appearing as an occasional peak. Electricity meters, cooling systems, water systems, rack telemetry, procurement records, and equipment inventories increasingly need to connect to the same operational narrative. PUE remains useful for understanding facility energy overhead, while WUE measures water consumption against IT activity and CUE addresses carbon intensity within defined measurement boundaries. None of those indicators, taken alone, explains workload duration, rack concentration, equipment utilization, or the lifecycle burden embedded in purchased infrastructure. A credible compliance record therefore needs traceable activity data behind every reported intensity figure. That requirement becomes especially important when enterprise customers use infrastructure disclosures to evaluate suppliers, outsourcing arrangements, and long-term sustainability performance.
Density Creates a Shadow Your Report Doesn’t Capture
A site-level environmental metric can flatten a highly uneven physical reality inside the hall. Consider a facility where a relatively small portion of racks carries the highest computing load while other cabinets operate at materially lower utilization, because the annual facility denominator treats their energy within the same boundary. The resulting PUE can remain valid while concealing the operational concentration that drives cooling demand, electrical loading, and equipment replacement patterns. WUE can create a similar blind spot when water consumption appears as a facility-wide figure without showing how dense compute changes the thermal-management profile supporting particular zones. CUE can describe carbon associated with energy consumption while leaving the spatial distribution of that consumption outside the metric itself. For decision-makers, that means a compliant number can still require a deeper operational layer before it becomes useful for comparing high-density deployment strategies.
The reported 26 kW average rack load in 2026 provides a current market reference for how computing intensity can concentrate within a constrained footprint. Higher rack power can increase the importance of liquid cooling, distribution capacity, thermal monitoring, and localized measurement even when the total site load changes less dramatically than rack-level conditions suggest. A reporting system that records only monthly utility consumption can therefore miss the operating detail needed to explain why two halls with similar annual electricity use have different thermal and equipment profiles. The same issue extends to carbon accounting when electricity consumption forms a major part of the operational inventory and the timing or location of that consumption affects the available emissions factors. Enterprise customers examining a supplier’s environmental data increasingly need evidence that connects aggregate figures to the physical assets and loads generating them.

The Hour You Report Matters More Than The Year
Annual totals can describe how much electricity a site consumed, but they cannot fully describe when intensive computing required that electricity. Continuous high-density workloads create a load profile in which sustained consumption can occupy particular hours, while the grid’s emissions characteristics can vary during those same periods. This makes time-stamped electricity data increasingly valuable for substantiating claims about renewable electricity procurement and operational carbon intensity, particularly as proposed Scope 2 revisions place greater emphasis on temporal matching for certain market-based electricity claims. Proposed revisions to electricity accounting guidance have specifically examined hourly matching and deliverability for market-based electricity claims, with feasibility measures and exemptions included in the proposal. A sustainability report that contains only an annual electricity total can leave important questions unanswered when customers examine how reported clean-energy claims correspond with actual operating hours.
Hourly reporting does not mean every sustainability metric needs to become an hourly metric. PUE remains an efficiency indicator that depends on defined measurement boundaries, while WUE measures water consumption during the operating phase and requires consistent calculation boundaries. The more important change involves preserving the underlying timestamps so auditors can trace aggregate figures back to the activity that produced them. Therefore, high-density facilities should retain synchronized records for utility meters, cooling energy, water consumption, renewable-energy instruments, rack loads, and relevant operational events. Those records can reveal whether an annual improvement came from genuine efficiency gains, lower utilization, a favorable operating profile, or a change in accounting treatment. For enterprise customers, that traceability can turn a sustainability statement from a static annual declaration into an auditable operating record.
Utilization Is The Missing Line In Your ESG Story
Efficiency measures how much resource an infrastructure system consumes relative to its defined output or activity, while utilization shows how much of the installed capability actually operated. Higher rack density can increase the amount of computing capacity concentrated within a rack, while actual utilization can vary according to workload and operating conditions. A facility can improve PUE while increasing absolute electricity consumption if it operates more computing capacity for longer periods. Conversely, a lower utilization period can reduce total electricity use without demonstrating a corresponding improvement in the efficiency of the infrastructure itself. The reporting record therefore needs enough operational context to separate installed capacity, available capacity, and consumed capacity. Without that separation, customers may struggle to understand whether environmental changes reflect engineering performance, workload demand, or simply a different level of utilization.
High utilization can strengthen asset productivity, but it can simultaneously increase the material consequences of every operational dependency supporting those assets. Higher sustained loads place greater importance on cooling performance, power conversion losses, water consumption where applicable, maintenance intervals, and equipment replacement planning. The disclosure challenge is to show what the infrastructure actually delivered rather than presenting maximum capacity as though it represented routine operation. Rack telemetry can establish load profiles, while facility meters can reconcile those profiles against total energy consumption and supporting infrastructure demand. That evidence can help explain why two sites with similar installed capacity produce different annual environmental results. The result is a more precise operating narrative in which utilization becomes a necessary companion to efficiency rather than a hidden variable behind it.
The Afterlife Is Now Part of The Disclosure
High-density infrastructure creates a lifecycle question that begins before equipment enters the rack and continues after it leaves the hall. Servers, accelerators, racks, power equipment, cooling components, cabling, and thermal materials can create upstream emissions through material extraction, manufacturing, transportation, and procurement. Scope 3 accounting already provides categories that can capture purchased goods, capital goods, waste generated in operations, and relevant end-of-life activities. The reporting challenge therefore shifts from simply recording what the facility consumes during operation to retaining evidence about what the facility purchased, replaced, transferred, reused, recycled, or discarded. High-density deployments can intensify this issue when accelerated hardware cycles increase the frequency of equipment refreshes or change the composition of the installed asset base. A lifecycle record gives customers a clearer view of environmental impacts that operating metrics alone cannot capture.
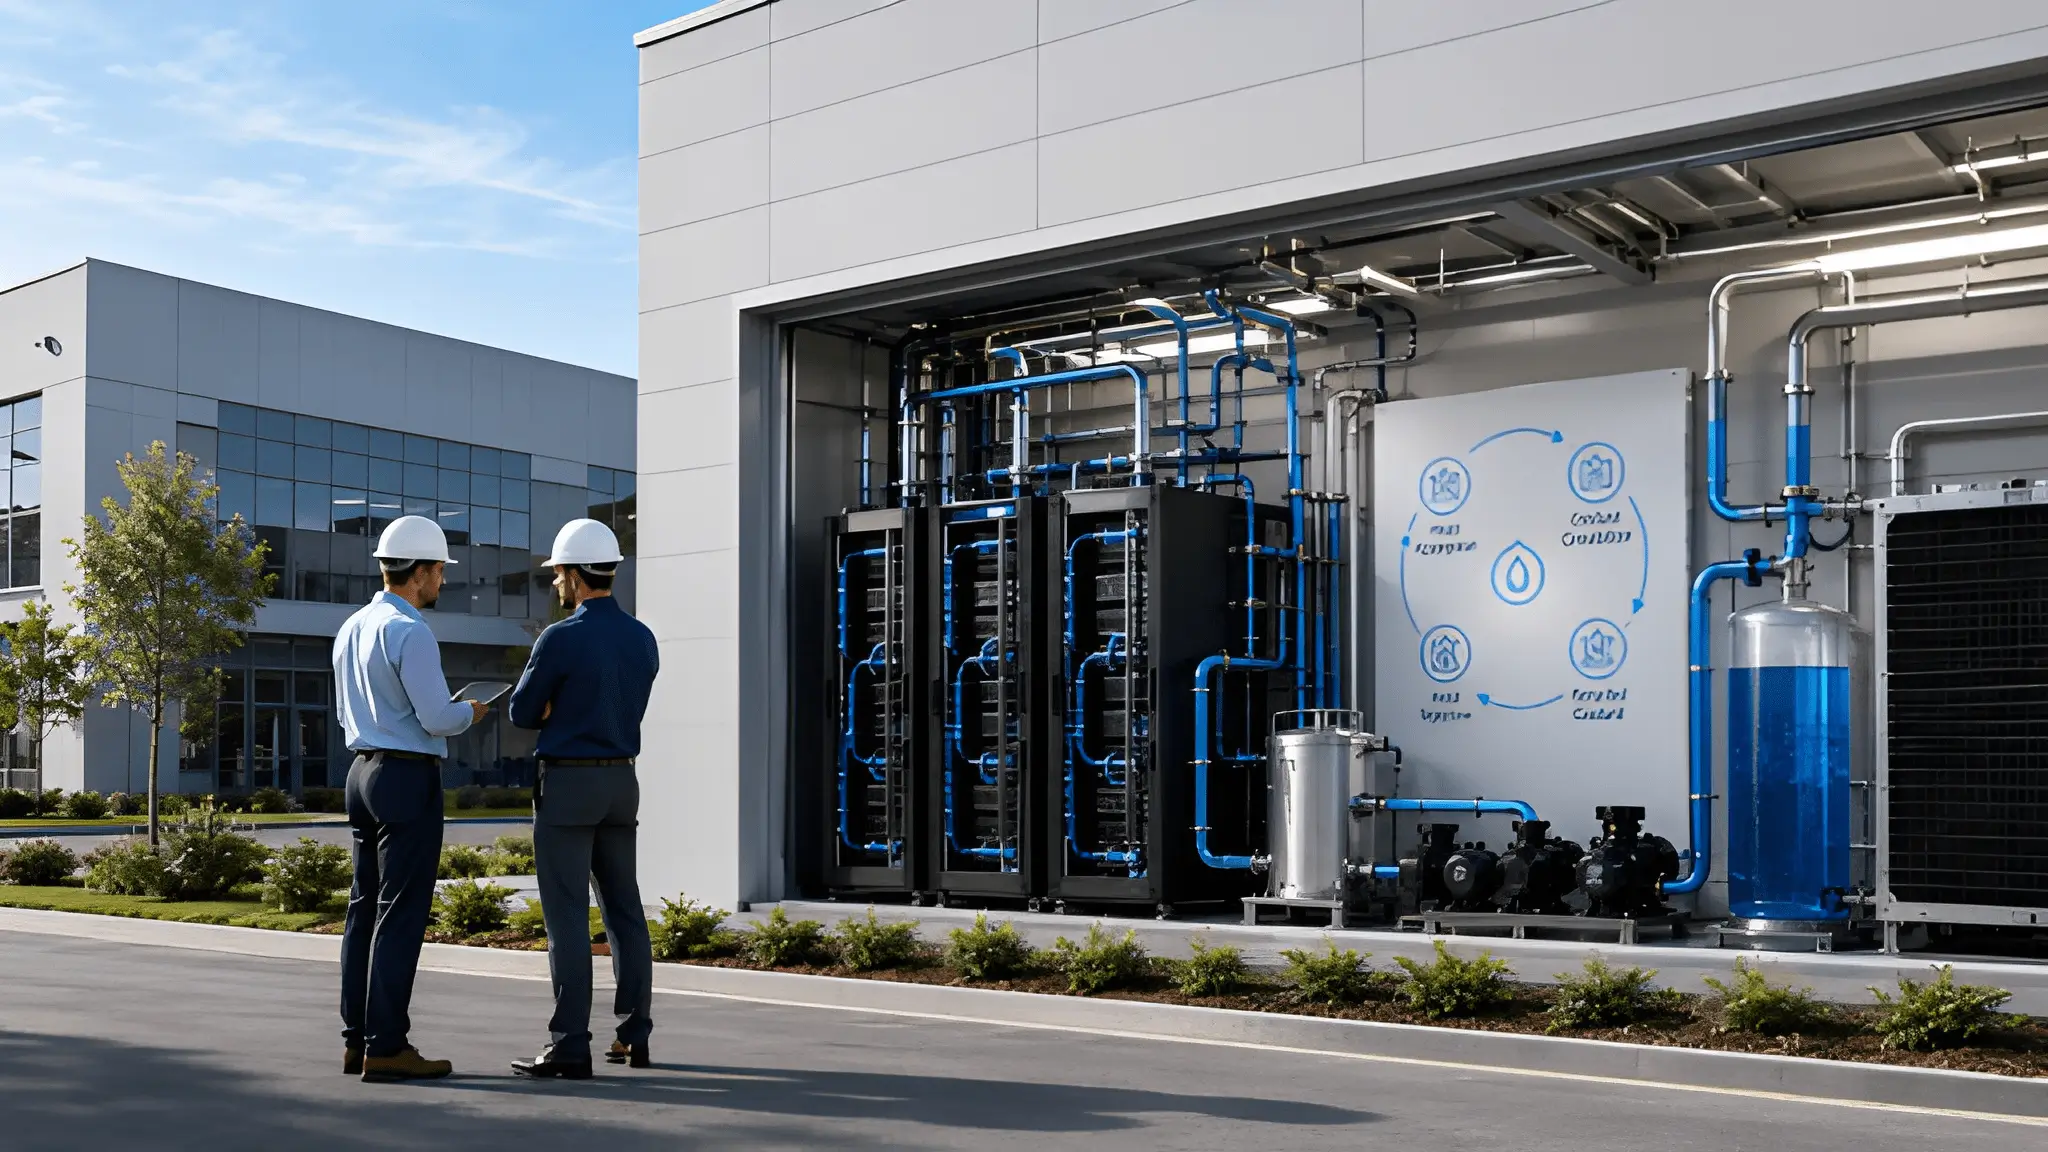
Thermal media deserve similar attention when a cooling architecture relies on fluids or specialized materials whose handling extends beyond routine operation. A credible lifecycle record should identify material type, quantity, procurement source, service history, recovery route, reuse potential, and final disposition where those data support the applicable accounting boundary. Circularity becomes more meaningful when the evidence demonstrates what happened to equipment rather than simply stating that recycling or reuse occurred. Meanwhile, lifecycle accounting can separate operational emissions from upstream and end-of-life impacts so companies do not attribute every environmental effect to facility electricity consumption. This approach can improve supplier questionnaires as well, since procurement teams can request asset-level evidence before equipment reaches the disposal stage. The result is a compliance trail that follows the physical life of dense infrastructure instead of ending when the equipment leaves the operating floor.
The Trail Is No Longer About The Building
The sustainability profile of a high-density site can benefit from more than annual facility totals when compute intensity concentrates inside smaller operating footprints. Density changes the relationship between rack power, cooling demand, utilization, electricity timing, water consumption, carbon intensity, and equipment turnover. PUE can explain facility overhead, WUE can quantify operational water intensity, and CUE can support carbon-intensity analysis, but each metric depends on defined boundaries and reliable activity data. Scope 2 accounting connects purchased electricity with emissions calculations, while Scope 3 accounting extends the record into purchased infrastructure and relevant value-chain activities. Together, these layers create a more complete evidence chain without requiring every metric to become a single composite score. The strategic issue for C-level operators is whether their measurement architecture can preserve that evidence as rack density, workload duration, and equipment composition change.
Ultimately, the compliance trail is moving closer to the actual operating behavior of compute rather than stopping at the boundary of the building. A site may occupy less physical space while carrying substantially greater electrical and thermal intensity, making spatial concentration relevant to operational interpretation even when standard facility metrics remain unchanged. The stronger reporting model connects the site, rack, workload duration, resource consumption, procurement record, and end-of-life pathway through traceable evidence. That model does not replace established sustainability indicators; it gives them the operational context needed for high-density infrastructure. Enterprise customers can then examine not only where computing capacity sits, but how consistently it operates, what resources it consumes, and what happens to the equipment after service.High-density compute is increasing the value of sustainability disclosure that tracks how compute operates across its full operating and material lifecycle.