Skip to content


A data center can reduce its direct water consumption without reducing the water burden associated with its operations. The apparent improvement may come from a change in where water enters the system rather than a genuine reduction in demand across the wider infrastructure supporting computation. When a facility relies on electricity generated by water-intensive power plants, its operational footprint extends beyond the cooling equipment, pipes, and treatment systems located on its site. A sustainability report that counts only water consumed within the facility boundary can therefore present a narrower picture than the underlying resource demands justify. For executives evaluating new capacity, the central question is not simply how much water a data center uses, but where that water comes from and what competing demands it serves. That question requires a consistent accounting boundary connecting facility operations, electricity consumption, water sources, and local environmental conditions.

The Boundary Lie: Counting Liters Where It Is Convenient
A facility-level water report can accurately describe on-site consumption while still missing a significant part of the infrastructure’s water footprint. Cooling towers, humidification systems, equipment cleaning, and other facility processes create direct demand, but electricity generation introduces another layer that a site-only inventory may exclude. Thermal power plants can withdraw water for cooling, return some of it to the original source, and consume another portion through evaporation. The quantities depend on generation technology, cooling configuration, operating conditions, and the source supplying the plant. A data center that reduces its direct consumption without examining these upstream effects may improve its reported performance without demonstrating an equivalent reduction across the electricity supply chain. Executives should therefore treat the reporting boundary as an explicit accounting decision rather than an unquestioned measure of environmental performance.
The problem becomes more consequential when companies compare facilities using figures that cover different parts of their operations. One operator might report only water consumed within its site, while another might include estimated water consumption associated with purchased electricity. Both figures can be internally accurate, yet a comparison between them would misrepresent their relative resource demands. A credible assessment needs to separate direct consumption from indirect consumption and explain how each figure was calculated. It should also identify whether the electricity estimate reflects an average grid mix, a specific supply arrangement, or another documented method. Consequently, a lower reported figure should count as an operational improvement only when the underlying boundary, measurement period, and calculation method support that interpretation.
Not All Liters Are Equal: Potable, Reclaimed, and What Actually Hurts a Community
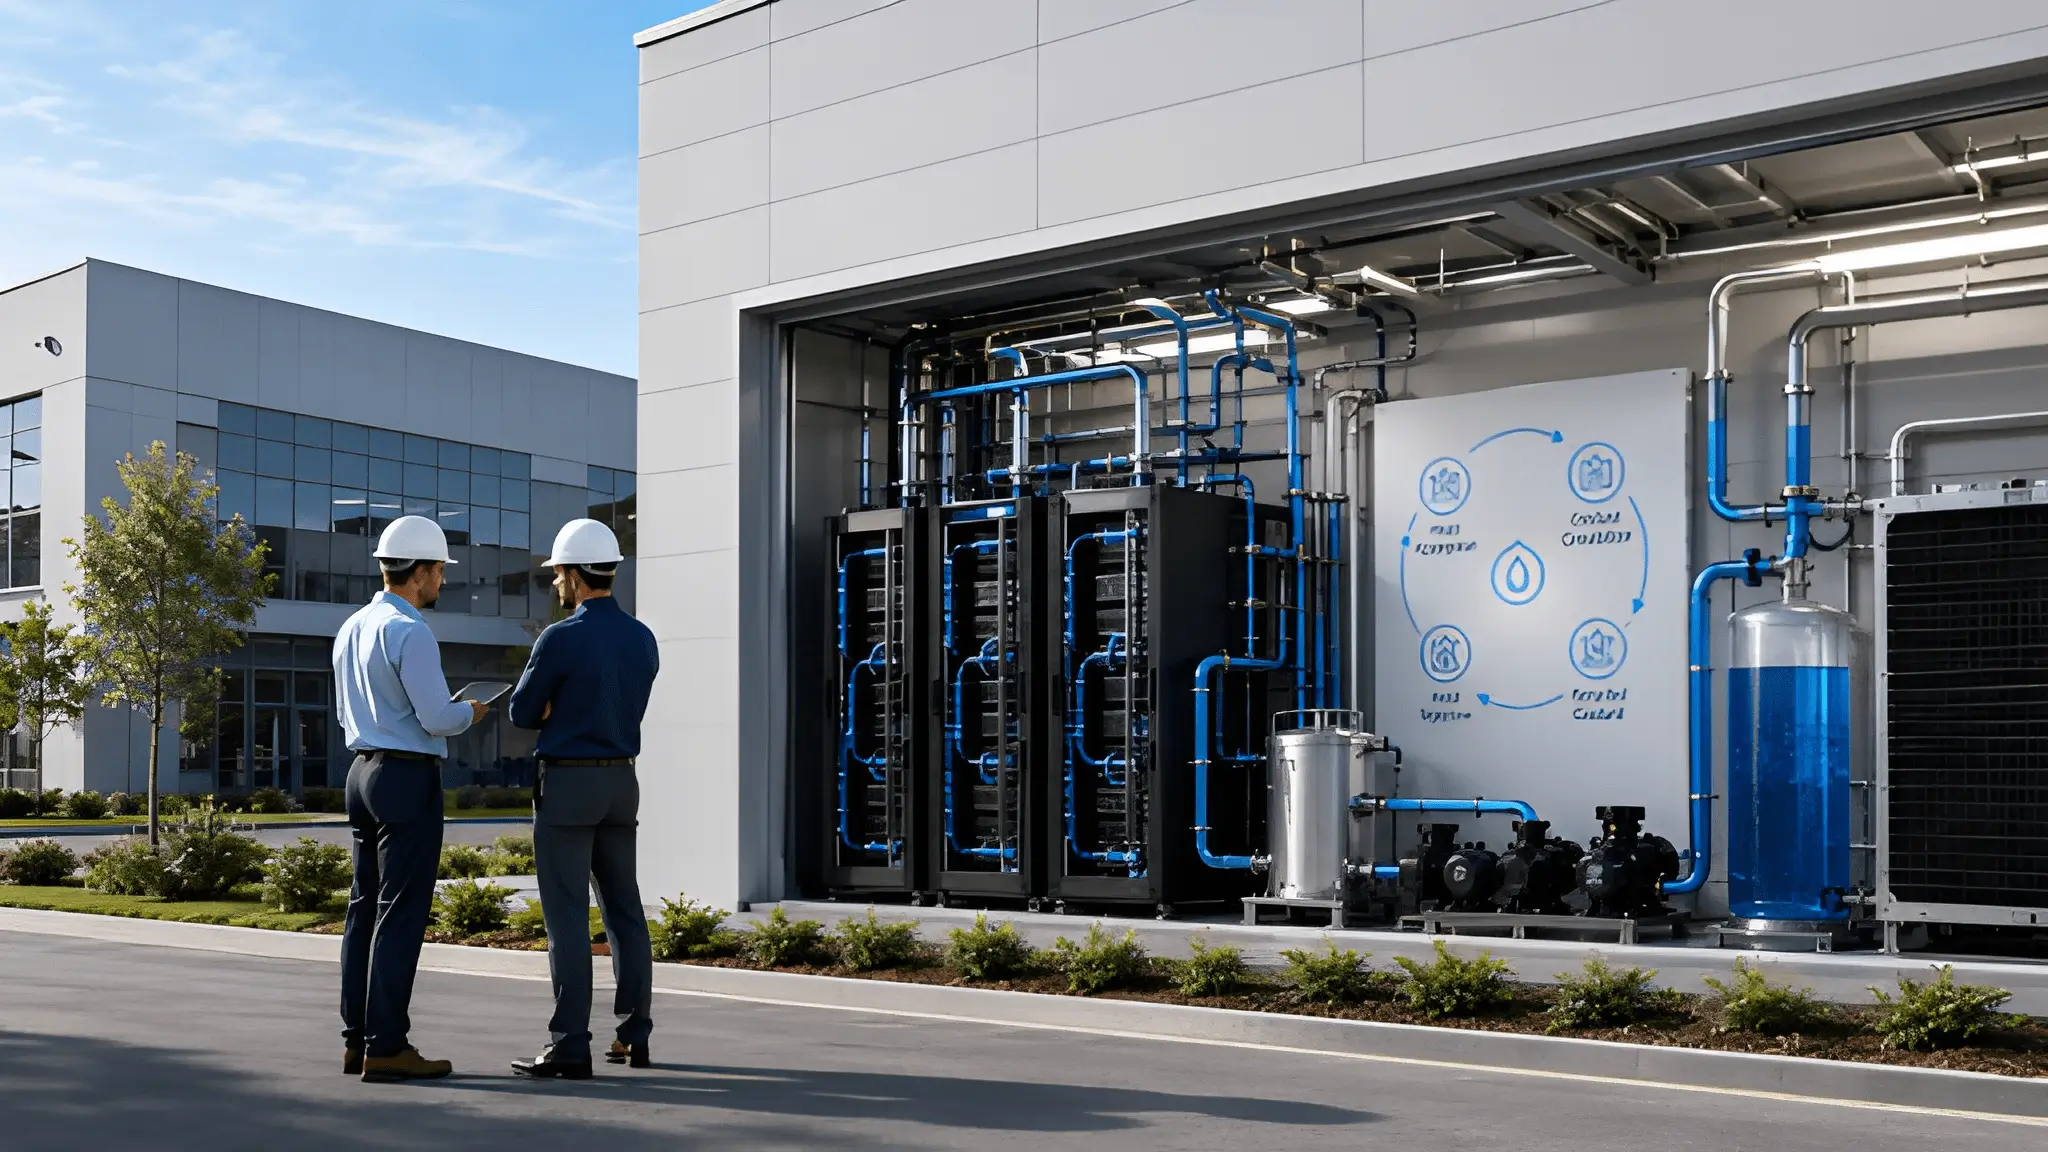
Water volume alone cannot explain the consequences of an industrial facility’s demand because the source determines which competing uses may face pressure. Potable water has undergone treatment to meet drinking-water standards and may share a supply system with households, hospitals, food services, and other essential users. Reclaimed wastewater can offer an alternative when treatment quality, delivery infrastructure, and operating controls suit the intended application. Condensate recovered from air-conditioning or other equipment may also provide a supplementary source, although its availability and quality depend on site conditions. These sources cannot simply replace one another without considering chemistry, treatment requirements, storage, and distribution. A responsible water inventory should therefore identify source categories separately instead of combining every incoming liter into one headline number.

A source label, however, does not establish that a project has no local impact. Reclaimed water may already support industrial operations, irrigation, environmental flows, or another established use, while additional treatment and pumping can require energy and create further infrastructure demands. A project that diverts treated effluent from an existing customer may transfer pressure rather than eliminate it, particularly when replacement supplies come from freshwater sources. Potable water also carries different implications depending on the reliability of the municipal supply, the condition of local aquifers, and the needs of surrounding communities. Operators must examine these relationships before describing non-potable sourcing as an environmental benefit. For example, a project using reclaimed water should disclose its source, treatment requirements, competing demands, and the arrangements that protect existing users.
The Displacement You Do Not See in Your Sustainability Dashboard
Reducing water consumption inside a facility can change the location and nature of water demand without removing the demand associated with its operations. A design that avoids routine evaporative cooling, for instance, may reduce direct water consumption while increasing electricity requirements under some operating conditions. If the additional electricity comes from generation that consumes water, part of the apparent saving may reappear upstream. The actual outcome depends on the technologies involved, the efficiency of the equipment, the electricity supply mix, and the water intensity of the generation serving the load. A company cannot establish a net water benefit by comparing facility cooling figures alone when the design also changes electricity consumption. The relevant analysis must compare the direct saving with the estimated change in upstream consumption using compatible boundaries and clearly documented assumptions.
This accounting challenge requires operators to distinguish between a measured reduction and an estimated transfer of demand. Direct water meters can establish what a facility withdraws, while electricity records provide the energy consumption needed to estimate associated water use beyond the site. Generation-specific water factors can improve the estimate, but a grid average may conceal meaningful differences between the plants supplying electricity at different times. The calculation should also separate withdrawals from consumption because water returned to a river or another source does not have the same immediate availability implications as water lost through evaporation. However, upstream estimates should not be presented with the same certainty as directly metered consumption when the underlying generation mix or plant-level data remain incomplete. An honest dashboard can show measured values, modeled estimates, assumptions, and uncertainty separately without reducing the analysis to a single flattering number.
Why Annual Totals Hide When a Region Actually Goes Thirsty
Annual water consumption provides a useful measure of total demand, but it cannot reveal whether that demand coincides with a period of limited local availability. A facility may operate throughout the year while its source watershed experiences substantial changes in rainfall, river flows, groundwater conditions, and competing withdrawals. Electricity generation can introduce another seasonal pattern because power plants may change their output as temperatures, cooling conditions, and system demand change. A single annual figure averages these different conditions into a number that says little about when the greatest pressure occurs. Monthly reporting can expose periods when facility demand rises as water availability declines or when upstream electricity generation faces its own constraints. This information gives executives a stronger basis for assessing operating risk than an annual total viewed in isolation.
The same facility can therefore present different water risks across the year without changing its equipment or nominal operating capacity. A site drawing from a dependable supply during wetter months may face tighter constraints during a dry season when households, agriculture, and ecosystems require water from the same watershed. The relevant assessment must connect monthly facility demand with source-specific availability and the needs already placed on local water systems. Upstream electricity estimates also need appropriate time resolution when generation patterns or cooling requirements change materially by season. Therefore, operators should retain annual totals for long-term comparison while adding monthly demand profiles, source categories, watershed context, and material periods of scarcity. This approach makes the timing of consumption visible and helps management evaluate whether contingency supplies, demand adjustments, or alternative sourcing arrangements can reduce pressure during vulnerable periods.
From Using Less Water to Using the Right Water, in the Right Place
A credible water strategy begins when operators stop treating the site boundary as the complete measure of environmental responsibility. Direct consumption remains essential because it captures the water a facility actually uses, but it cannot independently describe the demands created by the electricity supporting its workload. Source quality, local availability, seasonal conditions, and competing users determine whether a particular supply choice represents a meaningful improvement. Companies should report potable and non-potable water separately, distinguish withdrawals from consumption, and disclose the methods used to estimate upstream effects. They should also explain where reclaimed supplies originate and whether their use affects existing customers or other environmental needs. These practices allow decision-makers to assess water performance against the conditions that matter to the surrounding community rather than relying on a single site-level indicator.
For data center executives, the objective is not to maximize the appearance of water efficiency but to understand the consequences of each operational decision across the infrastructure that supports it. That requires a consistent accounting boundary, transparent assumptions, and enough local detail to connect consumption with actual resource constraints. Procurement teams can evaluate electricity and water sourcing together, while site planners can examine watershed conditions before committing to a location or expanding capacity. Sustainability teams can then explain which reductions they measured directly, which impacts they estimated, and where evidence remains incomplete. A smaller number on a dashboard is useful only when the accounting demonstrates what changed, where the change occurred, and whether the resulting burden fell or simply moved elsewhere. The strongest water strategy makes those answers visible before a project turns an apparent efficiency gain into a local resource problem.