Skip to content

AI infrastructure is becoming harder to understand from the outside because the physical footprint can remain almost unchanged while the electrical demand inside it changes dramatically. A familiar industrial building can absorb a new generation of computing equipment without adding another visible structure, new street frontage, or obvious change to its roofline. The electrical system, however, records every additional megawatt that the computing workload requires, making the meter a far more revealing indicator of what is happening inside the walls. A facility that once supported conventional enterprise workloads can now accommodate tightly packed AI systems whose rack-level requirements fundamentally alter how operators use transformers, switchgear, cooling equipment, and backup generation. The physical address may therefore remain constant while its electrical demand and potential significance to the regional power system increase. Infrastructure analysis that treats each building as one unit risks missing this internal shift in computing intensity.

The problem becomes more pronounced when infrastructure databases, commercial property records, and development trackers become the primary lens for measuring expansion. A building count answers where facilities exist, but it does not reliably explain how much computing each facility supports, how heavily its electrical infrastructure operates, or how quickly its demand profile has changed. Current industry datasets themselves show why the problem exists: one major directory lists more than 14,000 locations globally, while only about 5,300 listings contain a disclosed power figure. That gap does not mean every undisclosed facility represents substantial AI demand, but it demonstrates how incomplete power information remains across a large facility population. A better infrastructure measurement system would treat physical locations as containers and electrical demand as the variable that determines their significance.
The Density Flip Inside Old Walls
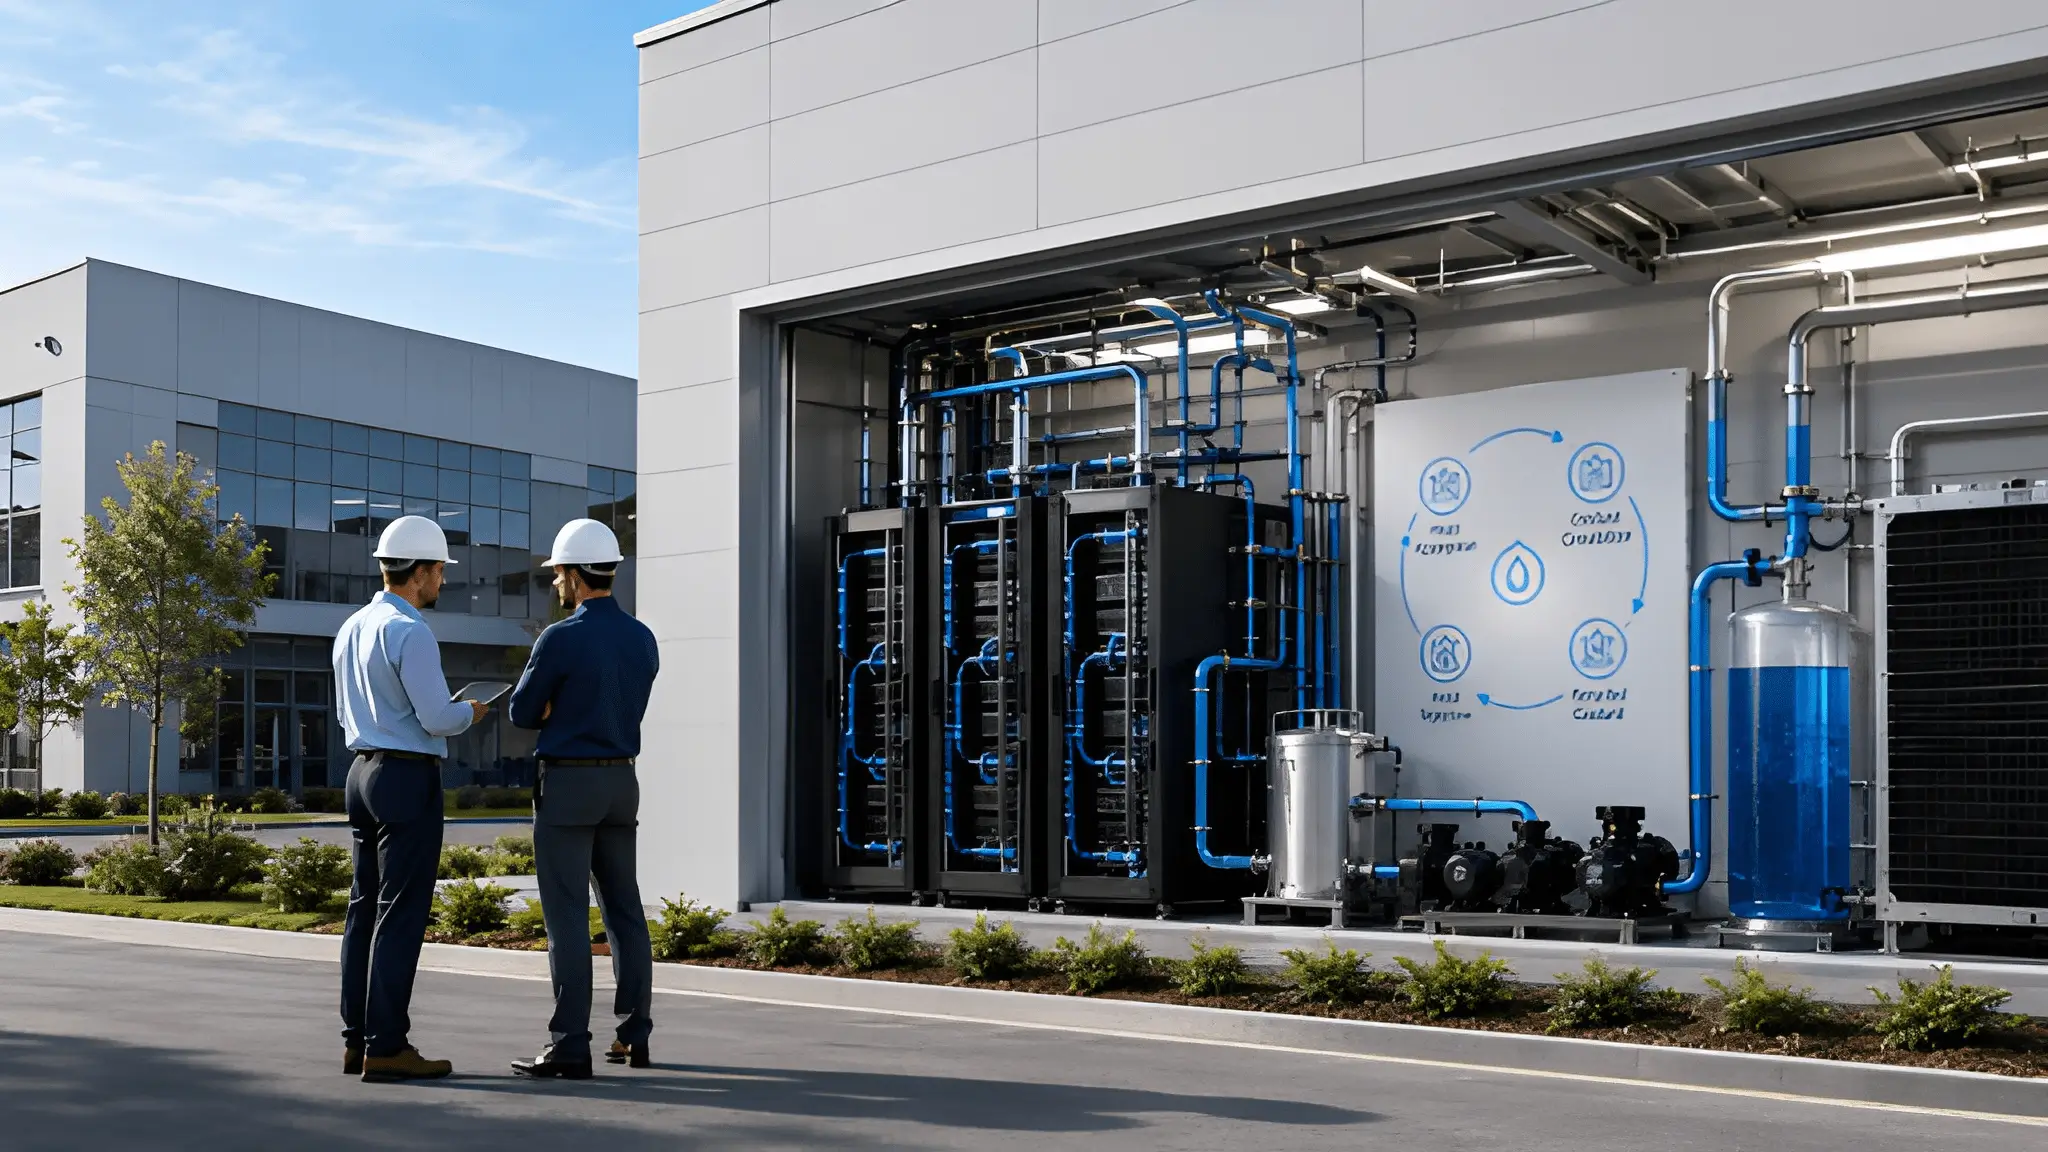
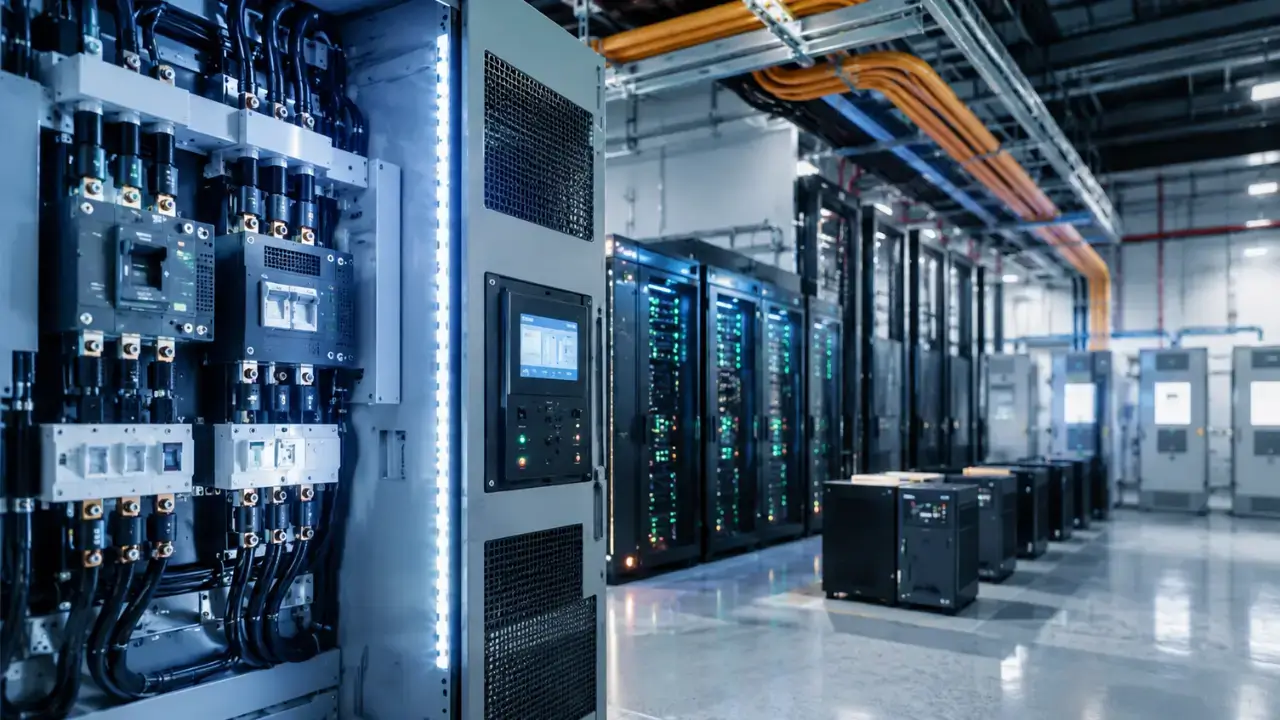
A building can undergo a major computing transformation without becoming a new building, and that fact changes the way AI infrastructure should be measured. Existing electrical systems often entered service around substantially lower rack densities than those demanded by current AI clusters, creating a mismatch between the original design assumptions and the equipment now moving into the space. Industry technical analysis has documented a progression from rack densities measured in single-digit kilowatts toward systems exceeding 50 kW per rack, with some configurations moving beyond 100 kW. That change can alter feeder loading, transformer utilization, busway requirements, power distribution, cooling capacity, and backup generation requirements even when the building envelope remains untouched. A technical area therefore cannot be treated as a fixed quantity of computing capacity simply because its walls and floor area remain unchanged.
Retrofitting creates another measurement problem because the increase in demand can appear gradually rather than through a single construction event. An operator may replace conventional servers with higher-density accelerators, reorganize racks, strengthen distribution equipment, modify cooling systems, or allocate additional electrical capacity to an existing technical area without creating a separate facility record. However, each modification can increase the site’s contribution to local electricity demand while conventional mapping systems continue to show one unchanged location. Technical research on AI retrofits notes that legacy electrical infrastructure can face requirements many times higher than the rack densities for which it was originally engineered. The physical site therefore becomes a less complete proxy for computational intensity once equipment density changes without a corresponding change in the surrounding structure.

Maps Show Dots. Meters Show Demand.
A map remains useful for locating infrastructure, but location alone cannot reveal the operational intensity hidden behind a physical address. Commercial property databases can identify buildings, while specialized directories can classify facilities by location, ownership, status, or type, yet their records frequently depend on publicly disclosed information rather than continuous electrical measurements. One current U.S. data-center methodology explicitly notes that published megawatt figures can represent different quantities, including critical IT load, gross facility input, utility service, interconnection requests, onsite generation, individual phases, or full-campus capacity. That variation makes two facilities with apparently comparable capacity figures difficult to compare unless analysts understand exactly what each number represents. A pin on a map cannot resolve that ambiguity because the pin identifies a place rather than an operating condition.
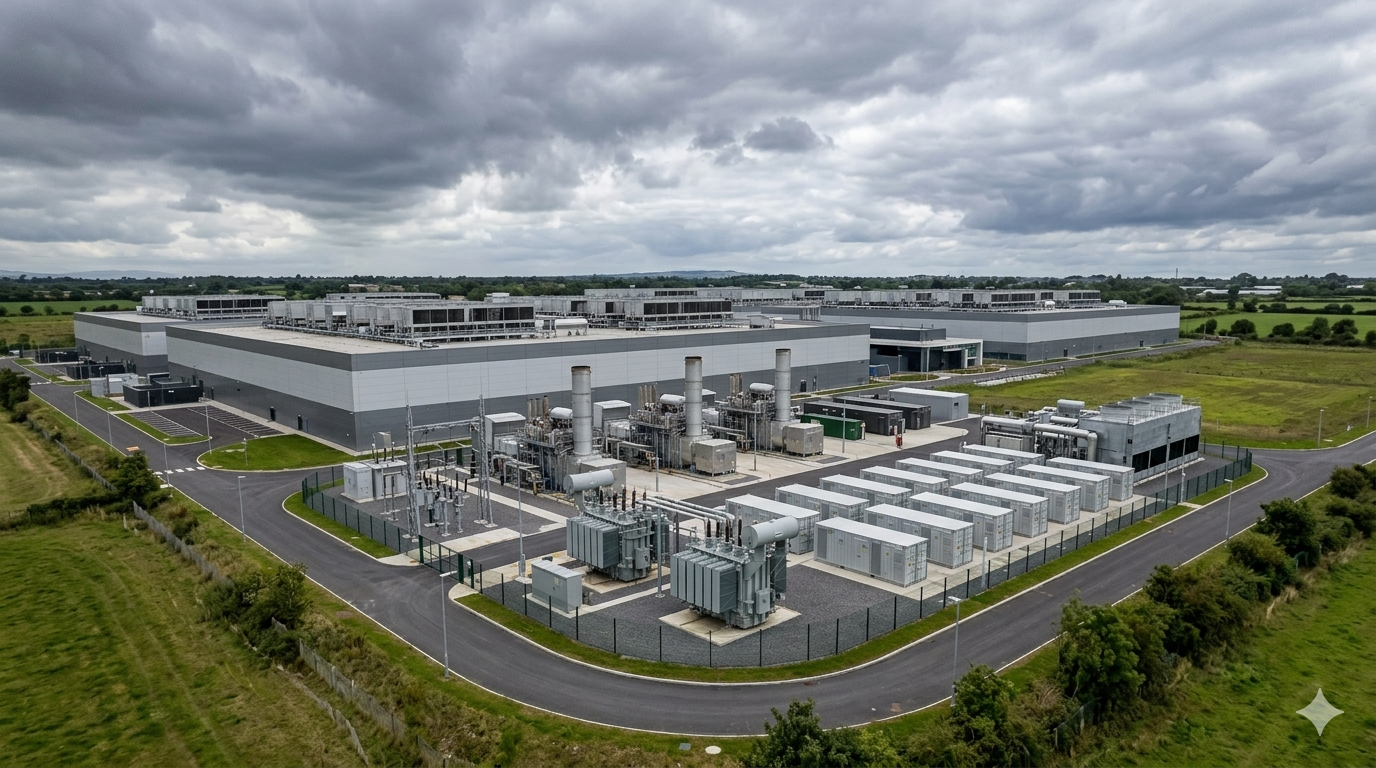
Environmental permitting records offer an additional clue because infrastructure that does not appear exceptional on a property map can leave measurable evidence through its supporting electrical equipment. Backup generators, for example, require permitting and documentation that can expose the scale of a facility’s resilience architecture even when the site’s computing capacity remains undisclosed. Current permitting guidance requires information such as engine rating, fuel consumption, and emissions characteristics for qualifying stationary engines. A detailed facility evaluation in California illustrates how generator infrastructure can accompany a site designed for tens of megawatts of load, providing a useful secondary signal about the electrical scale behind an otherwise ordinary industrial property. Meanwhile, these records should not become substitutes for actual electricity measurements because backup generation capacity does not equal normal operating demand.
The Uncounted Megawatts Distorting Every Forecast
The most consequential blind spot appears below the threshold at which analysts begin paying attention to very large facilities. A national population of smaller sites can collectively represent substantial demand even when individual facilities appear insignificant beside hyperscale campuses measured in hundreds of megawatts. A hypothetical scenario of 1,500 sites below 20 MW illustrates the arithmetic: if each site reached 10 MW of relevant load, the combined requirement would equal 15 GW. That calculation does not establish that 1,500 such AI-enabled sites exist or operate at that level, but it illustrates why facility counts can provide an incomplete picture when analysts do not also examine the distribution of electrical load across locations. A portfolio of modest facilities can therefore contribute to regional electricity demand without producing the physical footprint associated with a new large campus.
This matters particularly in established technology markets where existing electrical infrastructure already supports a large installed base of computing facilities. AI workloads can occupy capacity incrementally because existing facilities can be retrofitted for higher-density deployments, allowing electrical demand to change without requiring an entirely new building. Recent analysis of the U.S. market shows how rapidly power requirements are increasing, with current and planned facilities creating a large gap between physical project counts and their potential electrical requirements. Therefore, forecasts that begin with announced buildings can miss demand created by upgrades, expansions, tenant changes, and higher utilization inside facilities already counted. The problem becomes sharper when databases record only one facility even though its internal electrical demand has changed materially since the original listing. Forecast models can benefit from tracking load changes at existing sites rather than treating each location as a static asset.
Stop Counting Roofs. Start Counting Load.
Infrastructure intelligence becomes more useful when it follows the thing that actually constrains computing growth: available electrical capacity. A building can remain unchanged while its computing equipment, rack density, utilization profile, and cooling requirements move substantially upward, creating a new load condition without creating a new address. That reality makes the traditional building count increasingly incomplete as a measure of AI expansion. The more useful unit of analysis is a site’s measured or credibly documented electrical demand, paired with information about how that demand changes over time. Such a system would distinguish between a facility that merely exists and one that has become materially important to local power planning. It would also give infrastructure leaders a way to identify hidden growth before it appears in construction statistics or real-estate development reports.
The deeper issue is not whether building maps have value, because they remain useful for understanding geography, ownership, development activity, and physical concentration. The issue is whether those maps should continue to serve as the primary measurement of an industry whose most important changes increasingly occur inside existing walls. Power demand provides a direct measure of electricity consumption associated with a facility, while analysts can use contracted capacity and documented technical upgrades to add context about its computing infrastructure. A facility directory can tell an executive where an asset sits, while a load record can reveal how much electrical work that asset is actually performing. That difference becomes critical as AI systems increase computing intensity without necessarily requiring proportionate increases in physical footprint. Infrastructure measurement can therefore move beyond counting visible structures by also tracking changing electrical behavior across the installed base.