Skip to content

A sustainability audit can look perfectly clean until someone asks a more uncomfortable question: what happened to the electricity that was actually needed at the moment the workload demanded it, and what happened to the cooling load that supported it. An AI deployment can sit behind the same renewable procurement arrangement as another deployment while producing a different operational energy profile because one site can shift when it draws electricity and the other cannot. That difference does not automatically create a new Scope 3 category, nor does thermal storage become a carbon credit simply because it reduces grid demand during a particular period. It does, however, change the physical activity that sits underneath the inventory, which means the quality and timing of the underlying data can become as important as the procurement contract attached to the electricity.

The most important point is that an inventory does not treat every climate benefit as a reduction to the same line item, because corporate accounting separates purchased energy, upstream energy activities, capital equipment, and project-level effects to maintain consistency and avoid double counting. A microgrid can change the electricity a site purchases, while thermal storage can shift when the site purchases that electricity, and the equipment itself can create upstream embodied emissions that belong elsewhere in the inventory. Renewable energy certificates can change the market-based treatment of purchased electricity when they satisfy the applicable accounting requirements, but they do not erase the physical electricity demand of an AI workload or automatically turn every related upstream activity into zero emissions.
Why Buying More Credits Stopped Explaining Your AI Footprint
The renewable credit purchase is easy to see in a sustainability file because it arrives as a contractual instrument, a certificate record, or a supplier document that sustainability teams can reconcile against purchased electricity under the market-based method when the applicable criteria apply. The physical load behind an AI deployment is harder to describe because electricity reaches the site continuously while the workload, cooling demand, storage behavior, grid conditions, and generation profile can all change over time. Two sites can therefore use similar procurement language while operating with different physical relationships between electricity consumption and clean generation. The market-based method accounts for contractual instruments such as energy attribute certificates and supplier-specific arrangements, but the underlying guidance also requires teams to examine the characteristics and quality of those instruments rather than treating every renewable claim as interchangeable.
The emerging emphasis on temporal and geographic matching makes that limitation easier to see because an annual procurement record can conceal the fact that electricity consumption and clean generation do not necessarily occur together. Recent proposed revisions to Scope 2 accounting have included stronger treatment of hourly matching and deliverability, but those revisions remain proposals rather than a finalized replacement for the existing guidance. That matters for an audit because an end user should not present an emerging requirement as though it were already mandatory, yet the direction of the technical debate shows why hourly evidence is becoming increasingly relevant to sustainability claims. A workload that consumes electricity during periods when the contracted renewable resource is not generating can have a different physical relationship with the grid than a workload whose demand aligns with available clean generation.

Scope 3 Begins Where the Purchased-Energy Boundary Ends
The Scope 3 issue becomes clearer when the inventory sits alongside the physical story around it, because Category 3 covers upstream emissions connected with purchased fuels and energy that do not already sit inside Scope 1 or Scope 2. The reporting company accounts for purchased electricity in Scope 2, while upstream emissions from producing and delivering that energy can enter Scope 3 Category 3 under the applicable calculation boundary. Category 2 serves a different purpose because it covers upstream emissions from producing capital goods that the reporting company purchases or acquires, meaning equipment used to create a microgrid or thermal storage system can receive different accounting treatment from the electricity that operates that equipment. This is where sustainability teams can accidentally blend infrastructure effects with energy procurement effects and then attribute the entire result to one category.
The same boundary discipline matters when an end user compares two AI deployments that use similar computing equipment but operate at different sites with different energy arrangements. One site may purchase electricity and apply qualifying contractual instruments to its market-based Scope 2 calculation, while another may generate part of its electricity behind the meter and purchase less electricity from the grid. If the second site also uses thermal storage, its cooling system may consume electricity at one point and discharge stored cooling at another, changing the timing of grid demand without creating a separate category for the stored cooling itself. The upstream emissions associated with the energy that ultimately powers the system still need to follow the relevant Scope 3 calculation method, while the equipment’s embodied emissions follow the applicable capital-goods or purchased-goods boundary.
The Hour That Changes Everything in Your Emissions Math
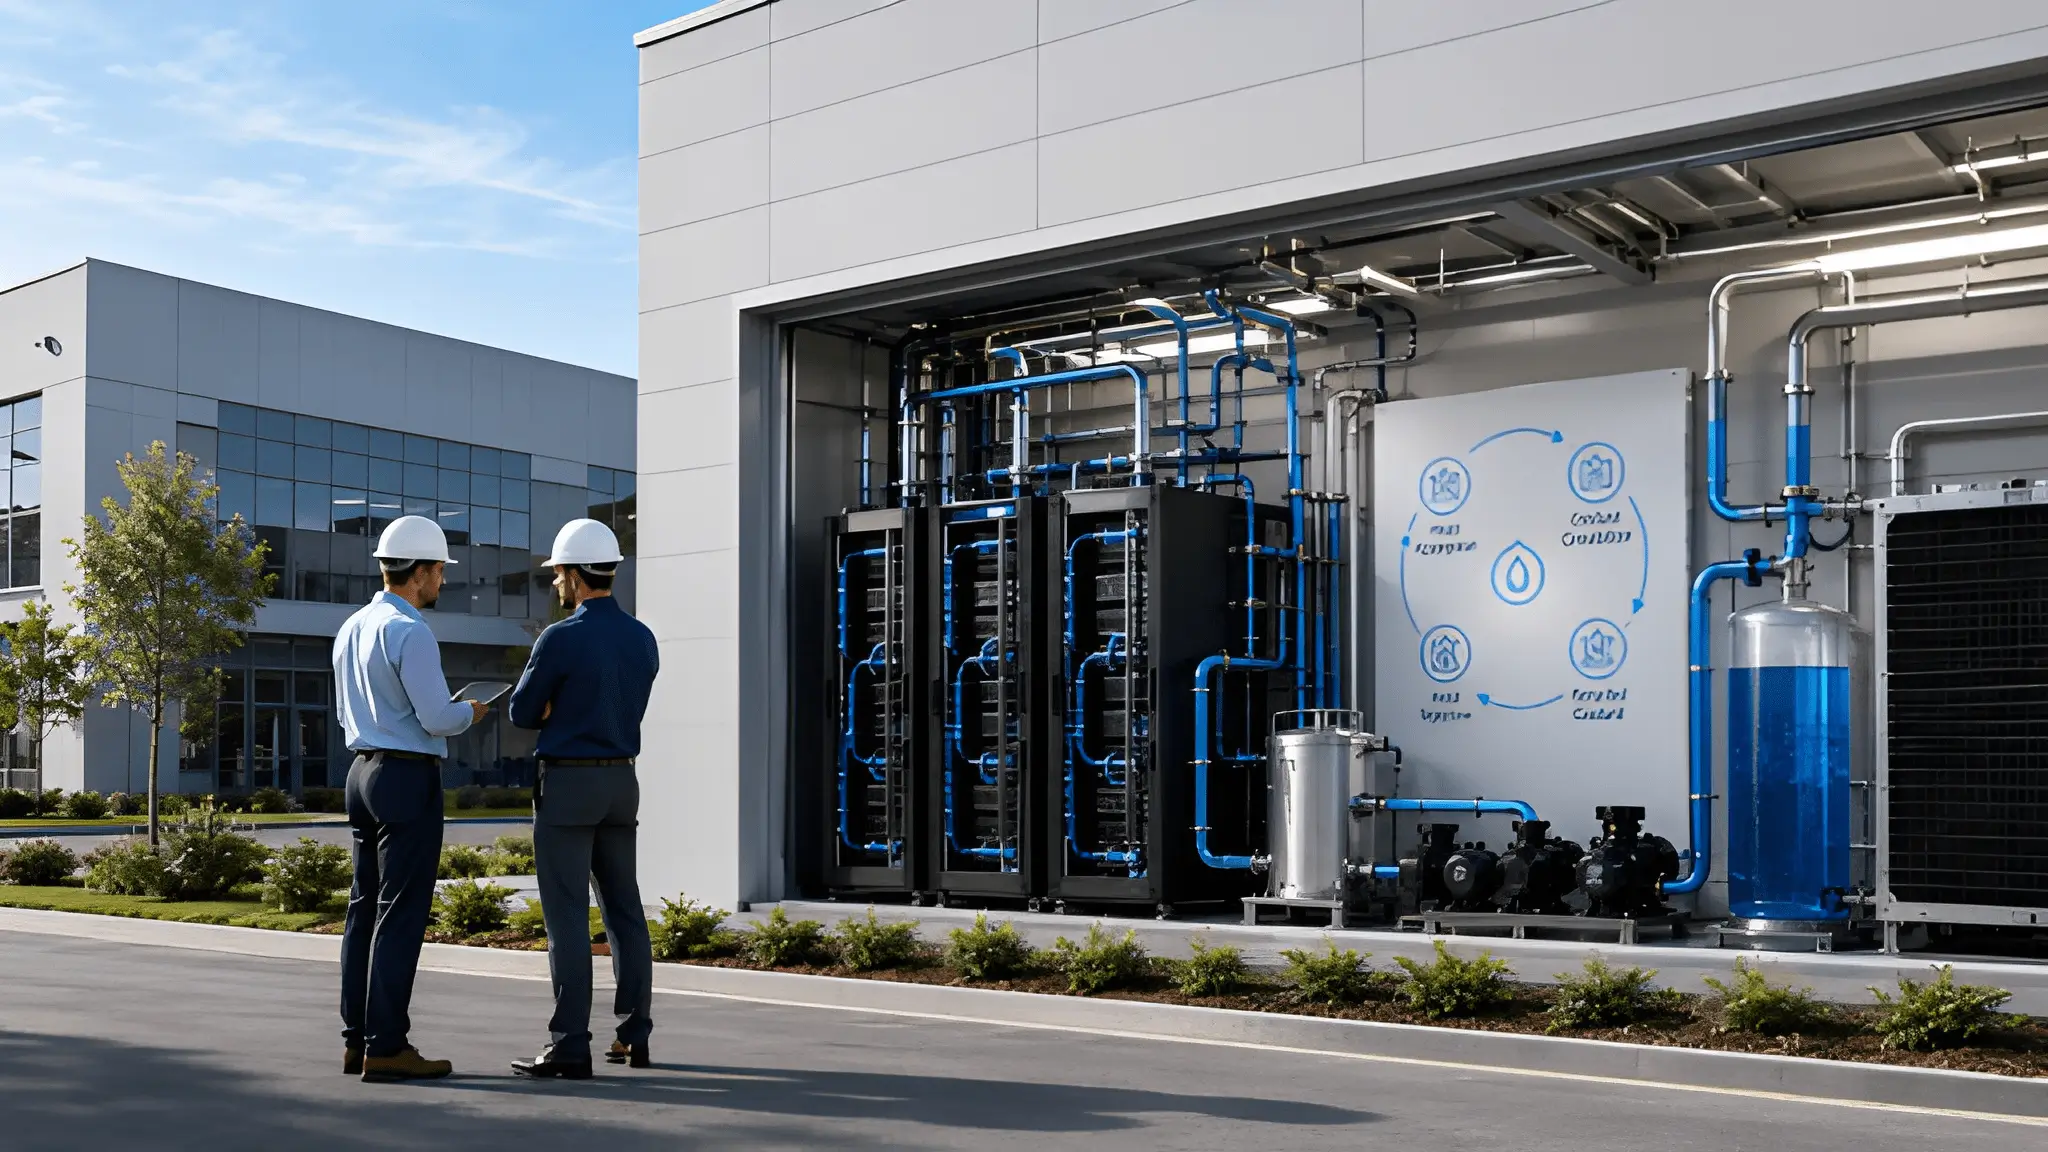
An AI workload creates a continuous stream of electrical demand, but the cooling system does not have to respond to every moment of that demand with an identical electrical response if the site has a thermal storage layer. Chilled-water or ice storage can allow cooling equipment to operate when conditions are favorable, store the resulting thermal capacity, and discharge that stored cooling when the computing load requires it. The physical benefit is load shifting rather than the creation of a new source of electricity, and that difference matters when sustainability teams interpret the resulting emissions data. A cooling system with storage can therefore make the site’s electricity curve look different even when the underlying computing workload remains unchanged.
This is where an hourly emissions factor becomes useful as an analytical instrument even when the formal corporate inventory continues to follow the applicable accounting requirements. An hourly factor can describe how the emissions intensity associated with electricity varies over time, allowing the end user to examine whether the site’s flexible cooling demand occurs during relatively higher- or lower-emissions periods. The analysis can become especially useful when the site operator supplies interval electricity data, thermal storage charge and discharge records, and information about the generation attributes associated with purchased power. The resulting curve does not automatically become a replacement for the inventory factor used in formal reporting, because the accounting methodology and the analytical question remain separate. It can instead explain why two sites with comparable computing activity and similar annual procurement arrangements can have different physical interactions with the electricity system.
Stored Cooling Creates a Different Carbon Curve
Consider two inference deployments with comparable computing behavior and comparable cooling requirements, where one site operates its cooling equipment directly against the instantaneous thermal load while the other can charge chilled-water or ice storage and discharge it later. The second site has introduced a controllable thermal buffer between computing activity and cooling-system electricity demand, which means the electrical load associated with maintaining the same computing service can move across time. That movement matters because electricity systems do not necessarily carry the same generation mix or emissions intensity at every hour, and analytical tools can use time-specific factors to make that variation visible. Public electricity datasets can provide emissions information at regional levels, while more granular datasets can provide interval data where credible and appropriate factors exist, allowing an audit team to test the relationship between consumption timing and emissions assumptions.
The accounting implication requires care because a lower-emissions hour does not automatically mean the reporting company can deduct an equivalent amount from its corporate inventory as avoided emissions. Inventory accounting records emissions associated with activities inside the defined boundary, whereas avoided-emissions analysis generally compares an intervention with a counterfactual scenario and estimates what might otherwise have occurred. The two approaches answer different questions, so a thermal-storage analysis can demonstrate an operational effect without entering the inventory as a negative emissions line. That separation becomes particularly important when the site uses renewable certificates because the certificates may affect the market-based treatment of purchased electricity while the thermal system separately changes the physical timing of demand. Combining both benefits into one undifferentiated reduction figure can obscure which mechanism produced which result and can create double-counting concerns.
When Your Inventory Meets a Thermal Battery
A thermal battery behaves differently from an electrical battery because it stores a cooling service rather than storing electricity for later electrical consumption. Chilled water or ice can form during one operating period and then serve the load later, reducing the electrical power that cooling equipment needs while the computing load continues. That makes the storage system an energy-flexibility mechanism whose environmental value depends on when it charges, when it discharges, what electricity powers the charging process, and what electricity demand it displaces at the site. The system therefore cannot qualify as a clean supply simply because its discharge reduces the instantaneous electrical requirement of the cooling plant. The underlying electricity used to create the stored cooling remains part of the site’s energy activity, while the storage system can change the timing and shape of subsequent electricity demand.
That distinction also prevents an important category error around avoided consumption, because a reduction in grid electricity demand at a particular moment does not necessarily become an inventory reduction calculated from a hypothetical alternative. If the cooling system would otherwise have consumed electricity during that same period, the site can measure the actual electricity avoided by the storage discharge as an operational comparison, but any estimate of the emissions that would have resulted requires a defined baseline and an appropriate emissions factor. Inventory accounting does not generally allow that counterfactual result to be inserted as a negative value simply because the storage system exists. The cleaner accounting approach is to report the measured energy activity within the inventory and, where appropriate, provide a separate analysis describing the emissions effect of shifting that activity.
The Scope 3 Boundary Follows the Source, Not the Equipment Label
Once the thermal system enters the inventory discussion, the first question should be what activity generated the emissions rather than whether the project carries a sustainability label. The production of a purchased thermal-storage system can create upstream emissions associated with capital goods when the equipment meets the applicable capital-goods definition, while electricity purchased to operate the system follows the energy-consumption boundary. Upstream emissions connected with the production of purchased electricity can then fall within Scope 3 Category 3 when they meet that category’s requirements and are not already included in Scope 1 or Scope 2. The same logic applies to other microgrid components, control equipment, power electronics, and related infrastructure because their embodied emissions arise from producing the equipment rather than from the electricity consumed during operation.
The resulting inventory can show a counterintuitive pattern in which installing more infrastructure does not necessarily make every sustainability number smaller in the same reporting period. New equipment can carry upstream embodied emissions, while its operation can reduce purchased electricity or alter the timing of electricity consumption, creating different effects across different parts of the inventory. That is not a failure of the infrastructure strategy; it is a consequence of separating emissions according to where and when they arise. A strong audit trail can instead show the equipment that was acquired, the energy that was consumed, the electricity attributes that were contracted, the thermal energy that was stored and discharged, and any separate counterfactual analysis used to evaluate avoided emissions.
The Location Signal Your Sustainability Story Is Missing
An AI workload does not exist in isolation from the electrical and thermal system that supports it, because the same computing service can create a different physical demand profile when the supporting site can shift cooling activity across time. That becomes relevant when an end user compares two inference deployments that use similar compute resources but operate under different cooling architectures, since one may respond to every thermal requirement with immediate electrical demand while another can draw on cooling that it produced and stored earlier. The difference does not automatically change the formal Scope 3 category assigned to the workload, because the accounting boundary still follows the underlying activity rather than the presence of storage equipment.
The difference becomes easier to understand through a simple comparison between two otherwise similar inference environments, where both consume electricity from comparable markets and both use renewable procurement instruments but only one has a thermal-storage system capable of moving cooling demand away from the computing peak. The first site may show a relatively direct relationship between computing activity, cooling electricity, and grid consumption, while the second site may show electricity consumption that rises earlier to charge the cooling reserve and falls later when that reserve supports the computing load. Neither profile should automatically be translated into a separate Scope 3 reduction because the inventory records emissions from defined activities rather than rewarding a particular shape of the demand curve.
The Same AI Service Can Carry a Different Carbon Curve
This is why workload placement deserves a more technical question than asking whether a provider operates on renewable energy, because the answer can hide the physical conditions under which the computing service actually runs. A sustainability team can ask whether the site can provide interval electricity records, whether cooling storage charges and discharges are separately metered, whether on-site generation has its own production meter, and whether the energy attributes used for market-based accounting correspond to the electricity consumption being reported. Those questions do not replace the formal inventory methodology, but they give the auditor a much stronger basis for understanding how the infrastructure produces the reported result. The same logic applies to thermal storage because its environmental effect depends on the timing of charging and discharge, the electricity used during charging, and the electricity demand avoided while stored cooling serves the load.
From Additionality Debate to Stored Reality
Additionality has traditionally attracted attention because buyers want to understand whether their procurement decision contributes to new clean-energy supply rather than merely reallocating an existing attribute, but that question does not answer every operational question raised by an AI workload. A renewable certificate can establish an attribute claim when it satisfies the relevant accounting requirements, yet the certificate does not describe the moment when an AI workload consumed electricity or the way a cooling system responded to that demand. A microgrid-linked site can provide a different type of evidence because on-site generation, storage, and controllable cooling can be measured through physical meters rather than inferred entirely from contractual documents. That does not make the physical infrastructure inherently eligible for a separate inventory deduction, because inventory accounting and project-level avoided-emissions analysis answer different questions.
The difference is particularly important because the GHG Protocol treats avoided emissions as a separate analytical concept rather than simply allowing every avoided-emissions estimate to reduce a corporate inventory. Its current work on consequential accounting explicitly separates the estimation of electricity-sector avoided emissions from the inventory accounting framework, which reinforces the need to keep operational claims and inventory claims on separate tracks. A thermal-storage system can therefore support an analysis showing that electricity demand moved away from a particular operating period without creating a negative Scope 2 or Scope 3 value by itself. The quality of that analysis depends on the baseline, the measured load, the selected emissions factor, and the evidence demonstrating that storage caused the change rather than another operational variable.
Stored Reality Creates Evidence That Procurement Alone Cannot Provide
The operational evidence from thermal storage can be particularly useful when an AI workload produces a relatively stable computing demand but the cooling system experiences changing external conditions, because the storage system can reveal how much flexibility exists between the computing service and the electrical system. A site can record when the cooling system charges its thermal reserve, when the reserve begins discharging, how long the discharge continues, and how the site’s electricity demand changes during those intervals. Those records can then sit alongside the electricity meter and generation meter so that an auditor can reconstruct the physical sequence rather than infer it from a monthly utility statement. The resulting evidence does not need to claim that every shifted kilowatt-hour represents a Scope 3 reduction, because its value comes from explaining the relationship between energy consumption and infrastructure behavior.
What a Microgrid-Linked Facility Actually Sends Back to Your Dashboard
A useful sustainability dashboard for a microgrid-linked AI site should begin with the data required to reproduce the energy story, because a single PUE value cannot show when electricity entered the site, when cooling was stored, or when stored cooling replaced active mechanical cooling. The minimum useful dataset can include purchased electricity by interval, on-site generation by interval, charging and discharge periods for thermal storage, cooling-system electricity, and the operating state of the storage system. Additional information can connect those measurements to workload activity so the end user can determine whether a change in the energy curve resulted from computing demand, cooling controls, storage operation, or another site condition. It also makes supplier data more auditable because the end user can compare meter readings with invoices, generation records, storage controls, and emissions-factor assumptions rather than accepting an aggregated sustainability figure without the underlying activity data.
Thermal discharge hours can then become a useful operational field because they show when stored cooling supplied the load without requiring the same immediate cooling-system response from electricity consumption. Storage duration can show whether the system behaves as a meaningful thermal buffer or merely provides a short operational adjustment, while charging periods can show whether the system creates demand at times that undermine the intended emissions benefit. Avoided peak demand can also appear as an operational metric, but the dashboard should label it as demand avoided rather than silently converting it into avoided greenhouse-gas emissions unless a separate calculation establishes the relevant baseline and emissions factor. The same dashboard can record the electricity generated by the microgrid, the electricity exported if export occurs, and the electricity purchased from the external grid so that the relationship between on-site production and grid consumption remains visible.
PUE and WUE Cannot Tell the Whole Thermal Story
PUE remains useful for understanding the relationship between total site energy and information-technology energy, while WUE can provide insight into water consumption associated with the cooling system, but neither metric by itself explains the temporal behavior of a thermal-storage system. A site can report a favorable annual efficiency ratio while still consuming electricity during periods when the operator would prefer to minimize grid demand, and another site can report a similar ratio while using storage to move cooling production across operating periods. The ratios therefore provide context but not the complete evidence needed for a time-sensitive emissions analysis. A more complete dashboard can place efficiency metrics beside interval electricity consumption, thermal charge and discharge behavior, on-site generation, and the applicable emissions-factor source so the end user can see how the components interact.
The quality of the dashboard ultimately depends on whether the provider can preserve the connection between operational records and accounting records, because an annual sustainability statement cannot reconstruct an hourly energy event after the underlying data disappear. A microgrid-linked site should therefore be able to identify which meter supports each energy value, which emissions factor supports each calculation, which contractual instrument supports the market-based electricity claim, and which operating record demonstrates the thermal-storage event. That separation also makes year-over-year comparisons more reliable because changes in procurement instruments can be evaluated separately from changes in physical infrastructure. If a site changes its renewable procurement but does not change its cooling system, the dashboard should reveal that procurement change without suggesting that the thermal behavior changed as well.
The Infrastructure Becomes Part of the Evidence Chain
The next generation of AI sustainability audits will require end users to ask providers questions that reach beneath the renewable-energy certificate, because the certificate describes an energy attribute while the infrastructure determines how the workload actually consumes energy. The first question should be where the electricity serving the workload comes from, but the next questions should examine when the site consumes it, how much cooling electricity the workload requires, whether cooling can be stored, and whether the site can demonstrate those behaviors through measured data. A microgrid can alter the electricity purchased from the grid, while thermal storage can alter the timing of cooling demand, and both effects require different accounting treatment from a renewable certificate.
That is the central shift for an AI sustainability audit: infrastructure does not replace accounting rules, but it can determine how much physical evidence is available to support the numbers that those rules produce. Renewable procurement can remain an important part of the electricity strategy, while microgrid generation can change purchased electricity and thermal storage can change the timing of cooling demand, yet each mechanism should remain identifiable instead of disappearing into one aggregate sustainability claim. The strongest reporting model therefore keeps the corporate inventory intact, adds operational evidence around energy and cooling behavior, and presents avoided-emissions analysis separately where the methodology supports it. The end user can then see whether an emissions result came from the electricity accounting method, a change in physical consumption, a change in energy supply, an infrastructure intervention, or a combination of those factors.