
The Land Grab Is Over. The Efficiency War Has Begun.
The AI infrastructure narrative changed in 2025. Owning GPUs no longer guarantees competitive advantage. The organisations that raced to acquire H100 clusters in 2023 are now confronting a harder question. What percentage of those clusters are actually producing useful compute? Research published on arXiv in April 2026 delivered the bluntest answer the field had yet produced. GPUs draw substantial power even when they show no meaningful compute, memory, or communication activity. This state, which researchers named execution-idle, appears across all six GPU platforms studied. It surfaces in both training and inference jobs across production and experimental settings alike. GPUs account for roughly sixty percent of power in multi-GPU servers. They represent approximately forty-one percent of total power in full AI clusters. The assumption that owned hardware equals productive hardware is therefore an expensive fiction. A high-density rack of Blackwell B200s costs approximately four million dollars in hardware alone. Sitting at forty percent utilisation, it burns capital at a rate that no cooling optimisation or energy tariff negotiation can offset. Innovation Endeavors framed the new performance unit precisely: token output per watt per dollar per second. That is the metric separating efficient operators from expensive ones. Everything else is noise.
The Idle GPU Epidemic
The idle GPU epidemic is structural. It does not arise from careless engineering. It emerges from the fundamental architecture of distributed AI workloads. Modern training runs involve many tightly synchronised processes. When any single process falls behind, every GPU waiting on that process sits idle. Meanwhile, power draw continues. The causes of this structural idleness fall into three distinct categories. First, data-ingestion lags. Slow data transfers between CPU storage and GPU memory stall the preprocessing pipeline. The GPU waits for the next data batch. During that wait, it draws between sixty and ninety percent of its full thermal design power. Useful computation, however, is zero. Second, networking bottlenecks. Distributed training synchronises gradient updates across nodes through high-speed interconnects. When those interconnects become congested, GPUs enter a communication-waiting state. The MLOps Community analysis of distributed training environments documents this problem precisely. GPU resources become costly and inefficient, consuming power while staying idle. Kubernetes schedulers help abstract infrastructure, but they cannot compensate for upstream networking constraints.
The Third Cause Operators Underestimate Most
Third, and most consequential, poor workload scheduling. When multiple jobs compete for the same GPU cluster without a topology-aware scheduler, resources fragment. One job occupies three-quarters of a node’s GPUs. Another job needs four full nodes but receives partial allocations. Both jobs underperform. Both consume power. Neither delivers optimal throughput. Datadog’s GPU Monitoring reference architecture identifies zombie allocations as a specific and measurable category of this problem. Key metrics including gpu.sm_active and gpu.process.sm_active reveal compute utilisation at both device and process levels. Without this telemetry, operators cannot distinguish a running job from a stalled one. They see power consumption. They do not see the absence of productive work behind it.
The Shift From Ownership Metrics to Efficiency Metrics
The financial reporting conventions of the AI infrastructure sector reinforce the ownership illusion. Earnings calls emphasise GPU count. Press releases announce cluster megawatts. Investor presentations display hardware procurement totals. None of these numbers tell a counterparty what percentage of that capital is generating productive computation. Innovation Endeavors described the resulting distortion directly. In modern AI clusters, hardware represents over seventy percent of all-in build cost. That ratio inverts the economics of the previous data centre era, where hardware was thirty to forty percent and infrastructure was sixty to seventy percent. That inversion changes everything about which operational metric matters. When infrastructure dominated cost, optimising PUE was the correct priority. When hardware dominates cost, every percentage point of GPU idle time represents tens of millions in wasted capital. A marginally inefficient cooling system wastes money. An underutilised GPU cluster wastes a multiple of that. The performance-per-watt efficiency metric captures this reality directly. It holds operators accountable not for owning hardware but for extracting work from it. Sustained performance-per-watt efficiency requires real-time visibility into workload behaviour at the process level, not aggregate cluster-hour reporting.
The Three Metrics That Actually Measure AI Infrastructure Health
MLOps observability platforms have converged on three operational metrics that differentiate high-performing from low-performing GPU fleets. The first is GPU streaming multiprocessor utilisation, measured at the process level rather than the device level. Device-level average utilisation obscures heterogeneous workloads occupying the same physical node. Process-level measurement reveals which specific jobs drive utilisation and which drain it. The second metric is memory bandwidth utilisation. A GPU executing compute-intensive matrix operations may show high SM utilisation but low memory bandwidth utilisation, indicating a memory-bound workload that needs batching optimisation rather than additional GPU allocation. The third metric is interconnect saturation. NVLink and InfiniBand utilisation measured at the link level reveals whether communication overhead is limiting training throughput. When interconnect saturation precedes SM utilisation drops, the bottleneck is networking, not compute.
MLOps Observability: The Technical Architecture
Traditional infrastructure monitoring was built around servers, networks, and applications. AI infrastructure monitoring requires an additional layer. It must span GPU device health, process-level compute and memory metrics, workload orchestration layer behaviour, model pipeline data flow, and application-level token economics simultaneously. Splunk’s Q1 2026 observability update described this expanded scope directly. Teams building applications powered by large language models encounter a new set of observability challenges. These go far beyond traditional application monitoring. The update introduced AI agent and infrastructure monitoring covering performance, quality, cost, and security risks simultaneously. Datadog’s GPU Monitoring reference architecture provides the clearest published specification of what full-stack GPU observability requires at the infrastructure layer. The architecture unifies GPU telemetry with container, process, and application context. It delivers observability spanning from device health and resource utilisation through workload behaviour and interconnect performance. This unification is not a convenience feature. It is operationally necessary. A GPU that shows full SM utilisation but generates no useful model output is exhibiting a failure mode that neither pure infrastructure monitoring nor pure application monitoring can identify in isolation.
From Telemetry to Action: The Closed-Loop Architecture
Collecting telemetry is necessary but insufficient. The operational value of MLOps observability platforms depends on their ability to translate telemetry into automated corrective action within timeframes that human operators cannot match. Modern GPU clusters run thousands of concurrent processes. Bottlenecks develop and resolve in seconds. A monitoring dashboard that reports problems after the fact serves audit functions. It does not salvage compute margins.
The closed-loop architecture that leading operators deploy connects telemetry ingestion, anomaly detection, root cause identification, and remediation into a single automated pipeline. When a workload scheduler detects that a specific job has caused interconnect saturation on a particular network segment, it does not alert an operator and wait. It automatically migrates the affected jobs to a less-congested topology, adjusts priority weights for the saturating workload, and logs the intervention for model training that improves future scheduling decisions. The cycle from detection to remediation runs in seconds. Revenue-relevant compute hours are recovered at a rate human operations teams cannot approach.
Digital Twins for AI Infrastructure
Digital twins represent the next tier of AI infrastructure intelligence. A monitoring platform observes and reports current state. A digital twin simulates future states and evaluates interventions before implementing them. Applied to GPU cluster management, a digital twin maintains a live computational model of the cluster’s workload distribution, thermal profile, power consumption, and networking topology. Operators use it to answer questions that real-time telemetry alone cannot address. The cognitive DCIM framework documented in a 2026 arXiv paper provides the most detailed published description of how digital twins operate in production AI data centre environments. The framework integrates physical infrastructure and workload data into a knowledge graph. That graph maintains relationships between hardware entities, their operational states, and the workloads running across them. When a predictive maintenance signal appears in GPU health telemetry, the knowledge graph identifies which specific jobs depend on the affected hardware, calculates the cost of preemptive migration, compares it against the cost of unplanned failure, and recommends the intervention with the better economic outcome.
The Economic Case From Real Deployments
The same arXiv framework reported specific financial outcomes from production deployment. Liquid-cooling efficiency improvements generated a thirty-one percent reduction in annual energy costs compared to air-cooled baselines. Demand response programme participation generated an additional revenue stream. Recovery of waste heat from warm-water cooling loops provided measurable district heating output, generating both carbon offset credits and utility fee income. Together, these outcomes demonstrate that digital twin optimisation does not simply reduce waste. It converts previously unmonetised infrastructure characteristics into active revenue streams. The idle GPU server scenario quantified in the same framework is equally instructive. Avoided revenue loss from forty-eight idle GPU servers was estimated at two hundred and seventy thousand dollars for a single unplanned downtime event. Prevention of that event did not require a human operator to diagnose and respond. The DCIM platform identified the impending hardware failure, scheduled the repair during a planned maintenance window two days later, and migrated the affected workloads to healthy hardware automatically. Downtime was zero hours. The response happened before the failure occurred.
The Tokenomics Layer: Connecting Infrastructure to Business Value
The separation between infrastructure teams and AI product teams is breaking down. It breaks down precisely because the infrastructure metric that matters most, performance per watt per dollar per second, is identical to the product metric that matters most. Both measure useful tokens generated per unit of resource consumed. Splunk’s Q1 2026 observability update formalised this connection by introducing what it called tokenomics metrics. These include time-to-first-token and estimated token costs alongside traditional operational metrics such as throughput and GPU utilisation. Time-to-first-token measures the latency between a user submitting a query and receiving the first token of the model’s response. This metric is not an infrastructure metric in the traditional sense. It is a user experience metric with direct revenue implications. An inference cluster that delivers low time-to-first-token at high throughput generates better user retention than one that processes the same number of queries with higher average latency distributed unevenly across sessions. Infrastructure teams that monitor only GPU utilisation and PUE cannot detect the workload distribution patterns that produce high latency variance. They need the tokenomics layer to connect hardware behaviour to user-facing outcomes.
The Cost Visibility Gap in Enterprise AI Operations
Most enterprise AI operations still lack granular cost attribution at the workload level. They know their total cluster power consumption, their monthly cloud compute bill or their hardware depreciation schedule. They do not know which specific training jobs, inference endpoints, or model experiments consumed what fraction of those costs. This cost visibility gap systematically distorts resource allocation decisions. Without workload-level cost attribution, engineering teams optimise for what they can measure. They measure experiment completion times and model performance metrics. They do not measure the dollar cost of running a poorly-batched inference workload that achieves ninety-seven percent accuracy while consuming three times the compute of an equivalent endpoint that achieves ninety-six percent accuracy. The difference between these two endpoints may represent hundreds of thousands of dollars per month at enterprise serving scale. MLOps observability platforms that integrate tokenomics metrics with GPU telemetry make this comparison possible and actionable.
The Mixed Fleet Problem
Enterprise GPU fleets are rarely homogeneous. An operator that deployed Hopper H100s in 2023, acquired Blackwell B200s in 2025, and is now piloting AMD MI300X accelerators for inference faces a mixed-fleet management problem. Each hardware generation runs different driver stacks. Every vendor exposes different telemetry APIs. Each architecture has different optimal batch sizes, memory access patterns, and power management states. A monitoring platform that ingests GPU telemetry from H100s without translating it to a common schema cannot compare the performance-per-watt efficiency of those H100s against B200s running adjacent workloads on the same cluster fabric. Datadog’s GPU Monitoring reference architecture specifically addresses this problem. The architecture provides full-stack observability across AI, ML, and HPC workloads. It spans device health and resource utilisation through workload behaviour and interconnect performance. Critically, it abstracts vendor-specific telemetry into a unified metric schema. This abstraction is what makes cross-hardware efficiency comparison possible. Without it, a facilities engineer managing a mixed H100 and B200 fleet is comparing metrics with different definitions, different sampling rates, and different normalisation conventions. They are making resource allocation decisions on incommensurable data.
Scheduling Across Hardware Generations
Topology-aware workload scheduling becomes dramatically more complex in mixed fleets. A training job optimised for H100 NVLink bandwidth characteristics may perform significantly differently when migrated to B200s with NVLink 6 capabilities. Conversely, a latency-sensitive inference workload that runs efficiently on B200s may hit memory bandwidth limits that the H100s in the same cluster never encountered, because the B200’s higher compute throughput exposes upstream memory access patterns as the new bottleneck. Digital twin platforms manage this complexity by maintaining workload performance models for each hardware generation. When a new job is submitted to the cluster, the digital twin simulates its performance across available hardware configurations before placement. It selects the configuration that maximises performance-per-watt for that specific workload type, based on historical telemetry from similar jobs. The Kubernetes integration that the MLOps Community framework documents handles the physical placement. The digital twin provides the intelligence that makes Kubernetes placement decisions optimal rather than merely functional.
Thermal Intelligence: Connecting Observability to Cooling
The convergence of AI workload observability and physical infrastructure management represents the next organisational frontier in data centre operations. GPU telemetry currently lives in two separate operational domains. IT operations teams consume it to manage workload performance. Facilities teams manage cooling infrastructure based on power consumption totals and temperature sensor readings in data halls. These two domains rarely share data in real time. Consequently, cooling systems respond to thermal events rather than predicting and preventing them. The cognitive DCIM framework’s knowledge graph architecture breaks this separation. By modelling GPU workload state as a node connected to physical infrastructure nodes, it enables cooling infrastructure to respond to workload characteristics rather than thermal consequences. When a large batch training job initiates across a full cluster, the knowledge graph knows that within fifteen minutes, the thermal output of those racks will rise by a predictable increment. The cooling infrastructure can pre-position coolant flow ahead of that thermal event. Alternatively, the scheduler can spread the job across racks with thermal headroom, maintaining the cooling system in a more efficient operating state without user-visible impact on training throughput.
The Energy Cost of Reactive Versus Predictive Cooling
The energy cost difference between reactive and predictive cooling at rack densities exceeding one hundred kilowatts is substantial. A direct-to-chip cooling system that responds to measured chip temperatures after they rise operates at higher coolant flow rates for a longer duration than one that anticipates the temperature rise and pre-positions flow. The pump energy required for the reactive response, though small per event, compounds across thousands of thermal events in a busy AI training cluster into a meaningful fraction of total cooling energy consumption. The arXiv DCIM framework quantified the cooling efficiency improvement that thermal intelligence delivers. Liquid-cooling efficiency improvements reduced annual energy costs by thirty-one percent compared to air-cooled baselines. This improvement reflects both the superiority of liquid cooling over air cooling for high-density workloads and the specific contribution of predictive thermal management to operating the cooling infrastructure at its most efficient setpoints. Reactive cooling leaves efficiency on the table. Predictive cooling recovers it.
The Competitive Divide Forming in AI Operations
The organisations deploying MLOps observability platforms and digital twin infrastructure in 2025 and 2026 are not simply improving their current operational efficiency. They are training the machine learning models that will make their observability systems progressively more accurate and responsive over time. A scheduling optimiser that has processed three months of workload telemetry from a specific cluster makes better placement decisions than one that started yesterday. A predictive maintenance model trained on eighteen months of GPU health data catches failures earlier and with fewer false positives than one trained on six months. This learning curve creates a compounding first-mover advantage. The operator who instruments their cluster today accumulates telemetry data that trains better models tomorrow. Their performance-per-watt efficiency improves as a function of time in deployment. A competitor who defers instrumentation for twelve months does not simply start from where the first mover started. They start from the beginning of a learning curve that the first mover has already climbed a year’s worth of gradient.
The Margin Capture That Separates Operators at Scale
McKinsey QuantumBlack’s enterprise AI insights in 2025 and 2026 documented this margin separation with enterprise client data. Operators achieving high AI utilisation outperform the majority of firms by a wide margin. The difference is not hardware generation. It is not cloud versus on-premises deployment. It is operational intelligence: the ability to monitor, diagnose, schedule, and optimise workloads at a granularity and speed that human operations teams cannot achieve without automated observability infrastructure. The financial arithmetic is straightforward. A one-hundred-megawatt GPU cluster spending thirty percent of its operating hours in measurable idle or underutilised states wastes thirty megawatt-hours of compute per hour. At a compute cost of three dollars per GPU-hour for frontier hardware, that represents millions of dollars monthly in wasted capital expenditure. Recovery of half that waste through observability-driven scheduling optimisation generates more financial return than any single hardware upgrade decision the same operator might consider. Performance-per-watt efficiency, not GPU count, is where AI infrastructure margins are now won or lost.
The Workload Scheduling Revolution
GPU cluster fragmentation is not a software bug. It is an emergent property of naive scheduling logic applied to expensive, topology-sensitive hardware. Standard schedulers treat GPUs as interchangeable units. They allocate the first available devices to each incoming job. This approach produces configurations where a four-node training job occupies devices spread across eight physical chassis, crossing multiple InfiniBand switches at each inter-node communication step. Every gradient synchronisation crosses more hops than necessary. Communication overhead rises. GPU SM utilisation falls while interconnect wait time climbs. Topology-aware schedulers use knowledge of the physical cluster fabric to make smarter placements. They understand that GPUs on the same NVLink domain communicate at dramatically higher bandwidth than GPUs on different chassis connected through InfiniBand. They understand which rack-level network segments are currently congested. Consequently, they place large synchronisation-intensive jobs on topologically optimal hardware subsets. Jobs that do not require tight coupling get placed on fragmented capacity that larger jobs cannot use efficiently.
The Bin-Packing Problem at Hyperscale
Topology-aware scheduling at hyperscale is fundamentally a bin-packing optimisation problem. Thousands of jobs with different resource requirements compete for tens of thousands of GPUs with different topological relationships. No human scheduler solves this optimally at runtime. The arXiv research on GPU execution-idle states confirms the consequence of suboptimal scheduling. Execution-idle intervals appear across all workload types and all hardware platforms studied. They are not rare edge cases. They are structural features of how AI workloads interact with GPU hardware under realistic operating conditions. Modern MLOps platforms deploy reinforcement learning-based schedulers that improve their bin-packing decisions through operational experience. The scheduler observes placement decisions and their throughput consequences. It updates its policy to prefer configurations that produced higher sustained SM utilisation. Over weeks of operation, this approach substantially reduces fragmentation-induced idle time without requiring manual tuning by the operations team.
Power State Management and the Idle Energy Problem
The April 2026 arXiv study on execution-idle states documented a finding that challenges a widely-held assumption about GPU power management. Operators commonly assume that GPUs in idle or waiting states draw minimal power. The research shows the opposite. A GPU in an execution-idle state, waiting for data, waiting for a network synchronisation barrier, or waiting for a checkpoint write to complete, draws between sixty and ninety percent of its full thermal design power. The power management states that would reduce this consumption require explicit application-level cooperation to activate. Most AI training frameworks do not implement this cooperation by default. Smart power management patents filed by hardware manufacturers describe the architectural solution. When a cluster resource manager detects a predictably idle window, it can switch specific GPUs from an idle state to a quiescent state of zero power utilisation. The cluster resource manager monitors GPU utilisation, calculates windows of predictable underutilisation on a recurring basis, and transitions idle GPUs accordingly. This capability exists in hardware. Its exploitation requires the observability infrastructure to detect those idle windows reliably and act on them faster than the GPU’s re-activation latency allows.
The Savings That Accumulate From Power State Optimisation
For a one-hundred-megawatt cluster with thirty percent effective idle time, moving idle GPUs from sixty-percent-power idle states to near-zero quiescent states during predictable idle windows recovers a meaningful fraction of wasted power. Applied across large clusters at scale, these savings accumulate into substantial annual energy cost reductions. The arXiv DCIM framework’s thirty-one percent energy cost improvement reflects this category of optimisation, combined with predictive cooling management, alongside the elimination of unplanned downtime. None of these outcomes requires different hardware. They require better operational intelligence applied to the hardware already deployed. The US patent literature on smart GPU power management describes methods that resource manager modules implement automatically, switching power to idle GPUs and maintaining them in quiescent states until processing requirements mandate reactivation. Leading MLOps observability platforms are integrating these power state management capabilities into their closed-loop automation layers. As AI clusters grow larger and hardware costs dominate data centre economics ever more absolutely, this integration represents one of the highest-return engineering investments available to any operator managing production GPU infrastructure.
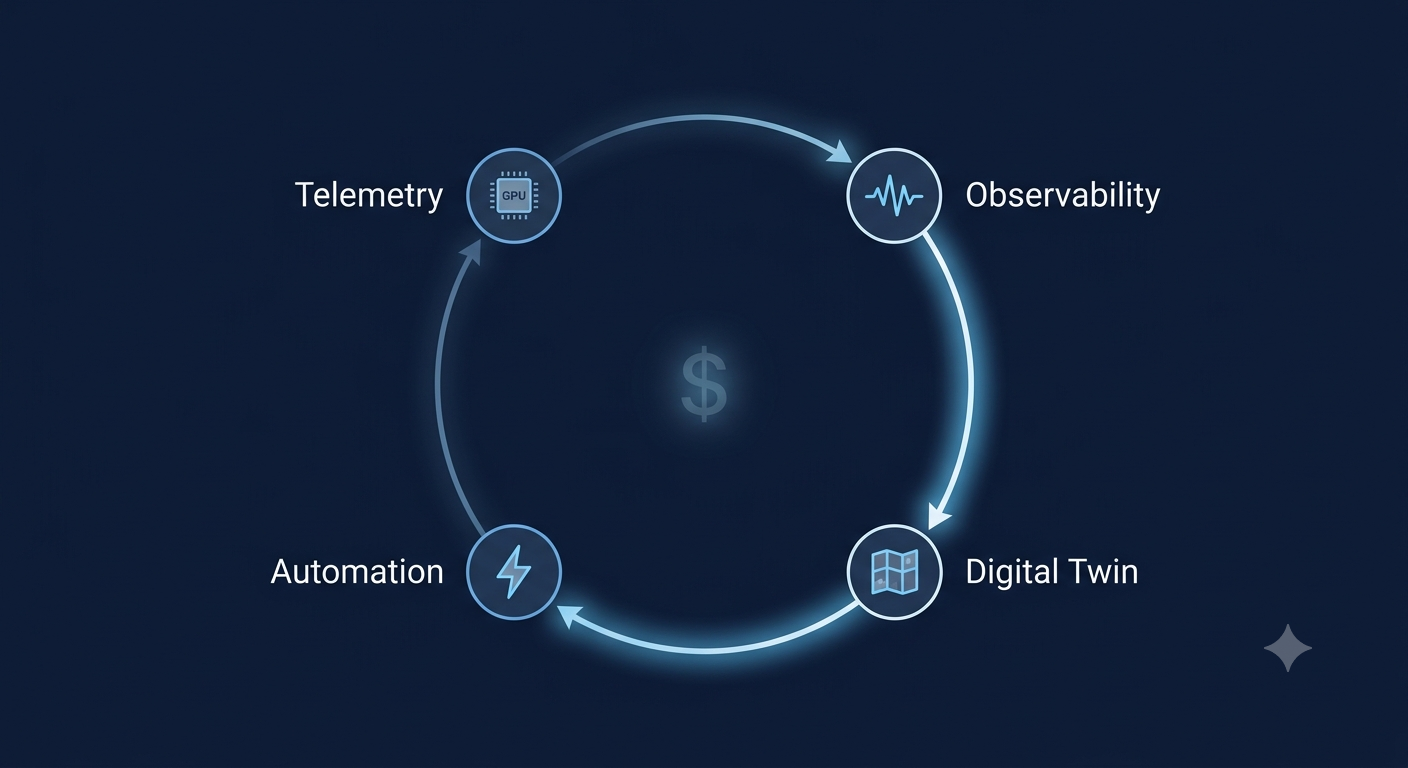
Implementing the Self-Optimising Stack
Building a self-optimising AI infrastructure ecosystem requires assembling four distinct but interconnected capability layers. Layer one is raw telemetry collection. Every GPU in the fleet exports device health, SM utilisation, memory bandwidth, power draw, and interconnect metrics at sub-second resolution. This data flows into a time-series telemetry store with retention sufficient for seasonal workload pattern modelling. Layer two is unified observability. The telemetry store feeds a platform that normalises vendor-specific metrics into a common schema, correlates infrastructure telemetry with workload behaviour, and surfaces anomalies at a rate and granularity that human operators cannot process manually. Splunk’s AI infrastructure monitoring and Datadog’s GPU reference architecture represent the current leading implementations of this layer.
Layer Three and Four: Intelligence and Automation
Layer three is the digital twin. The knowledge graph maintains a live simulation of the cluster’s physical and logical state. It generates intervention recommendations based on the delta between current state and optimal state. It evaluates those interventions in simulation before executing them on hardware. Layer four is closed-loop automation. Approved intervention categories, workload migration, priority adjustment, cooling pre-positioning, and power state management, execute automatically when the digital twin recommends them and predefined confidence thresholds are met. The cognitive DCIM framework’s production results confirm what this four-layer stack delivers. Zero unplanned downtime on the most critical hardware assets. Thirty-one percent energy cost reduction from optimised cooling. Revenue generation from demand response and waste heat recovery. Cultural transformation of the operations team from reactive troubleshooters to strategic capacity architects. The self-optimising ecosystem is not a future state. It exists in production. The operators building it now are compounding advantages that commodity GPU purchases and energy tariff negotiations cannot recover.


